

Viral vector-based improvement of optic nerve regeneration: characterization of individual axons' growth patterns and synaptogenesis in a visual target
- PMID: 26005861
- PMCID: PMC4600032
- DOI: 10.1038/gt.2015.51
Viral vector-based improvement of optic nerve regeneration: characterization of individual axons' growth patterns and synaptogenesis in a visual target
Abstract
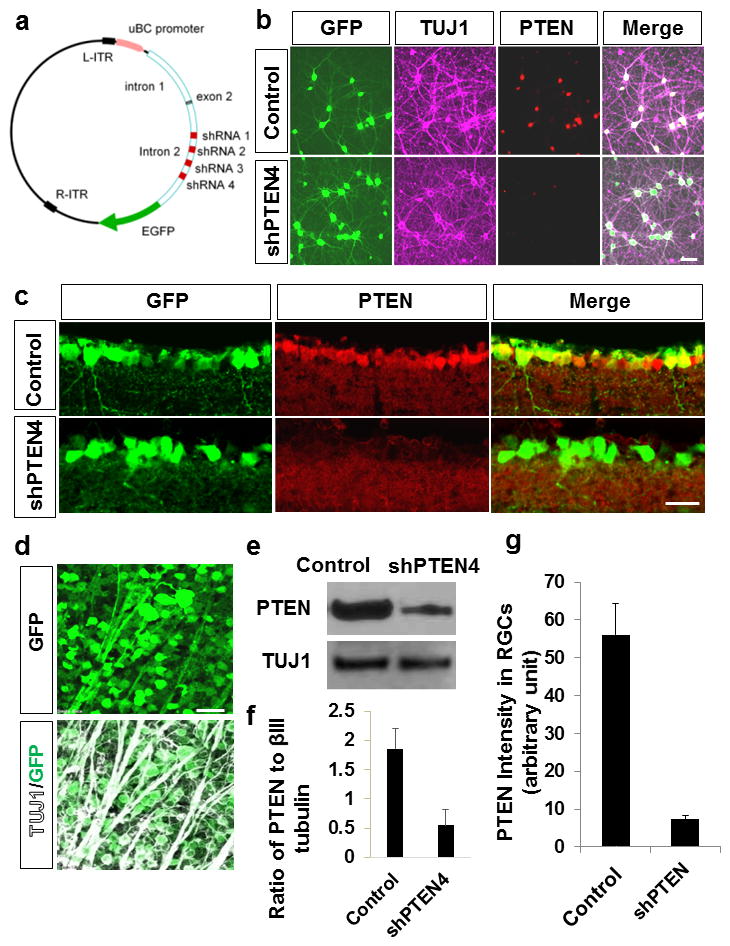
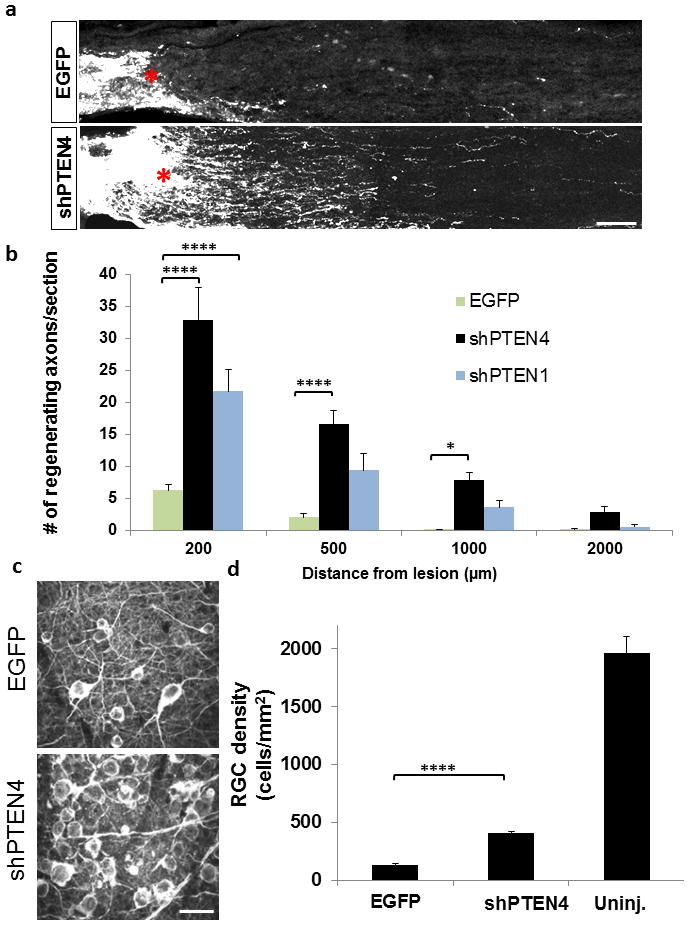
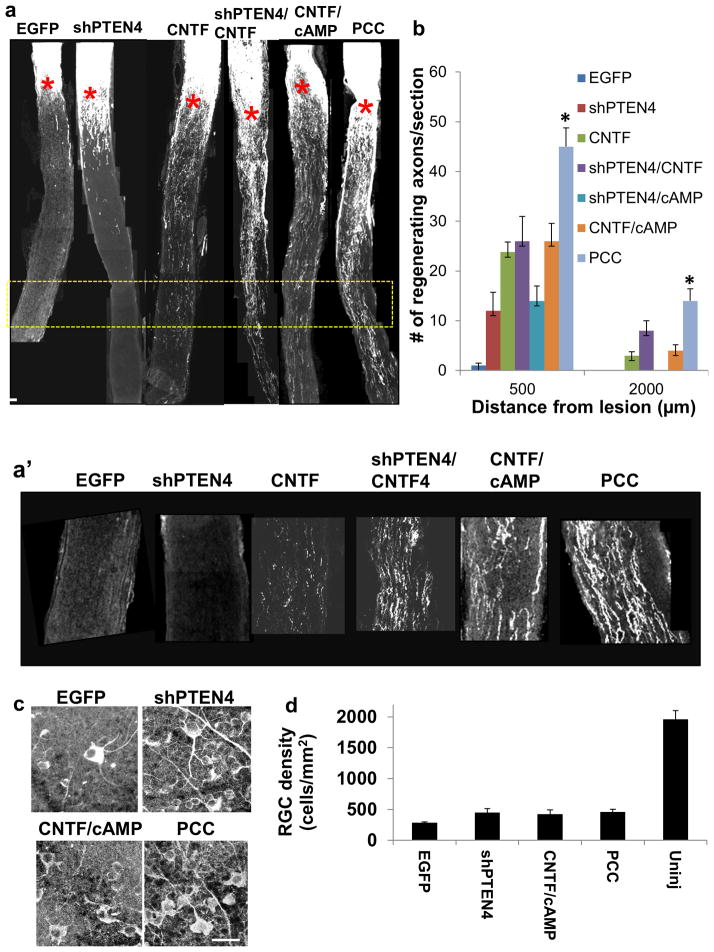
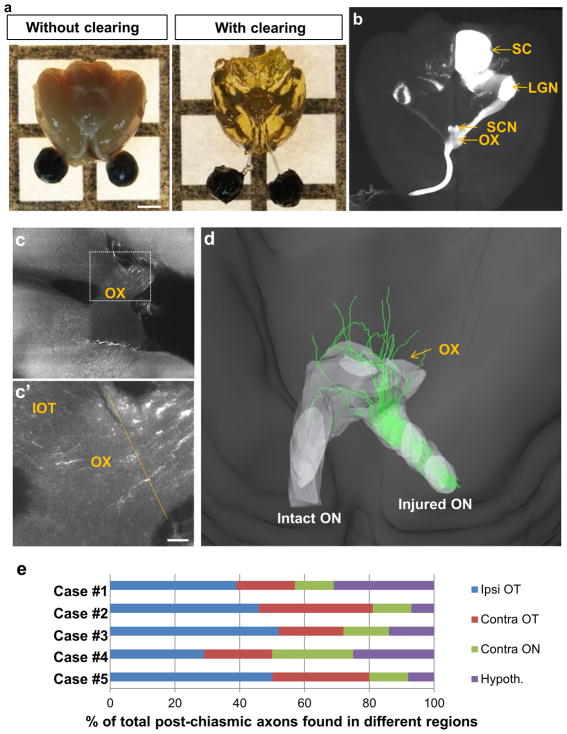
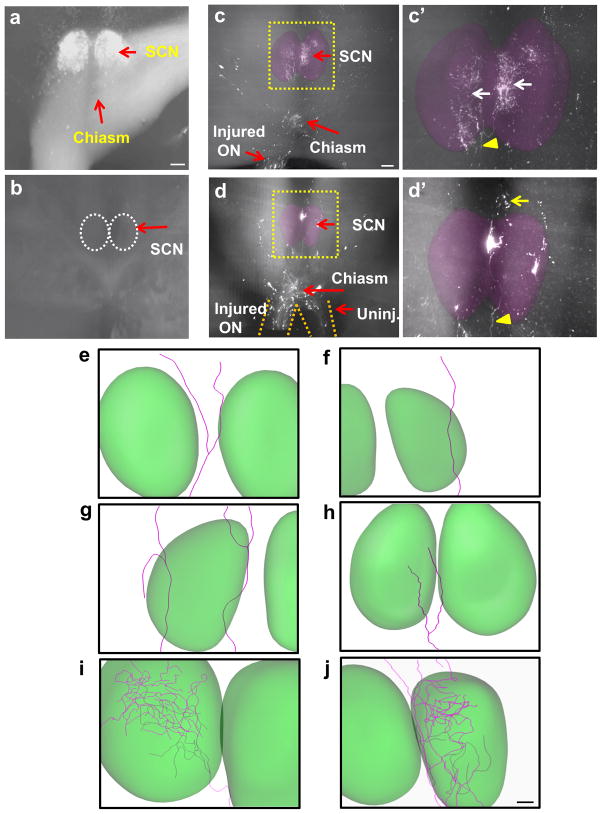
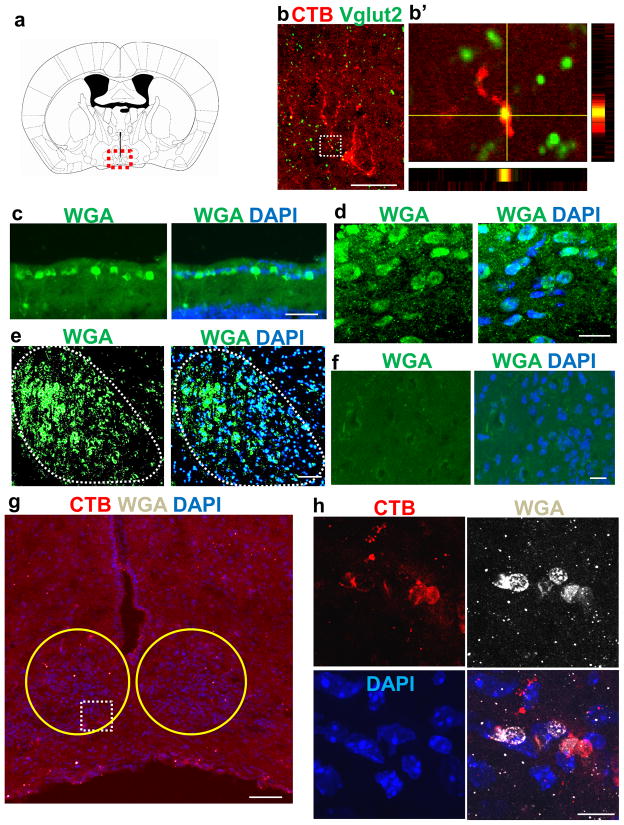
Lack of axon growth ability in the central nervous system poses a major barrier to achieving functional connectivity after injury. Thus, a non-transgenic regenerative approach to reinnervating targets has important implications in clinical and research settings. Previous studies using knockout (KO) mice have demonstrated long-distance axon regeneration. Using an optic nerve injury model, here we evaluate the efficacy of viral, RNA interference (RNAi) and pharmacological approaches that target the phosphatase and tensin homolog (PTEN) and signal transducer and activator of transcription-3 pathways to improve long-distance axon regeneration in wild-type mice. Our data show that adeno-associated virus (AAV) expressing short hairpin RNA (shRNA) against PTEN (shPTEN) enhances retinal ganglion cell axon regeneration after crush injury. However, compared with the previous data in PTEN KO mice, AAV-shRNA results in a lesser degree of regeneration, likely due to incomplete gene silencing inherent to RNAi. In comparison, an extensive enhancement in regeneration is seen when AAV-shPTEN is coupled to AAV encoding ciliary neurotrophic factor (CNTF) and to a cyclic adenosine monophosphate (cAMP) analog, allowing axons to travel long distances and reach their target. We apply whole-tissue imaging that facilitates three-dimensional visualization of single regenerating axons and document heterogeneous terminal patterns in the targets. This shows that some axonal populations generate extensive arbors and make synapses with the target neurons. Collectively, we show a combinatorial viral RNAi and pharmacological strategy that improves long-distance regeneration in wild-type animals and provide single fiber projection data that indicates a degree of preservation of target recognition.
Conflict of interest statement
Figures
Similar articles
-
Regenerative Responses and Axon Pathfinding of Retinal Ganglion Cells in Chronically Injured Mice.Invest Ophthalmol Vis Sci. 2017 Mar 1;58(3):1743-1750. doi: 10.1167/iovs.16-19873. Invest Ophthalmol Vis Sci. 2017. PMID: 28324115 Free PMC article.
-
AAV-mediated transfer of RhoA shRNA and CNTF promotes retinal ganglion cell survival and axon regeneration.Neuroscience. 2017 Feb 20;343:472-482. doi: 10.1016/j.neuroscience.2016.12.027. Epub 2016 Dec 23. Neuroscience. 2017. PMID: 28017835
-
Cooperative effects of bcl-2 and AAV-mediated expression of CNTF on retinal ganglion cell survival and axonal regeneration in adult transgenic mice.Eur J Neurosci. 2006 Dec;24(12):3323-32. doi: 10.1111/j.1460-9568.2006.05230.x. Eur J Neurosci. 2006. PMID: 17229081
-
Gene therapy and transplantation in the retinofugal pathway.Prog Brain Res. 2009;175:151-61. doi: 10.1016/S0079-6123(09)17510-6. Prog Brain Res. 2009. PMID: 19660654 Review.
-
Lab review: Molecular dissection of the signal transduction pathways associated with PTEN deletion-induced optic nerve regeneration.Restor Neurol Neurosci. 2019;37(6):545-552. doi: 10.3233/RNN-190949. Restor Neurol Neurosci. 2019. PMID: 31839616 Free PMC article. Review.
Cited by
-
Regenerative Responses and Axon Pathfinding of Retinal Ganglion Cells in Chronically Injured Mice.Invest Ophthalmol Vis Sci. 2017 Mar 1;58(3):1743-1750. doi: 10.1167/iovs.16-19873. Invest Ophthalmol Vis Sci. 2017. PMID: 28324115 Free PMC article.
-
Engineered bio-functional material-based nerve guide conduits for optic nerve regeneration: a view from the cellular perspective, challenges and the future outlook.Regen Biomater. 2024 Nov 22;12:rbae133. doi: 10.1093/rb/rbae133. eCollection 2025. Regen Biomater. 2024. PMID: 39776856 Free PMC article. Review.
-
Hyperactivated Stat3 boosts axon regeneration in the CNS.Exp Neurol. 2016 Jun;280:115-20. doi: 10.1016/j.expneurol.2016.03.004. Epub 2016 Apr 6. Exp Neurol. 2016. PMID: 27060489 Free PMC article.
-
Transcriptomic profiling of retinal cells reveals a subpopulation of microglia/macrophages expressing Rbpms and Spp1 markers of retinal ganglion cells (RGCs) that confound identification of RGCs.bioRxiv [Preprint]. 2023 Jan 24:2023.01.23.525216. doi: 10.1101/2023.01.23.525216. bioRxiv. 2023. Update in: Brain Res. 2023 Jul 15;1811:148377. doi: 10.1016/j.brainres.2023.148377. PMID: 36747805 Free PMC article. Updated. Preprint.
-
Engineering an in vitro retinothalamic nerve model.Front Neurosci. 2024 May 21;18:1396966. doi: 10.3389/fnins.2024.1396966. eCollection 2024. Front Neurosci. 2024. PMID: 38835836 Free PMC article.
References
Publication types
MeSH terms
Substances
Grants and funding
LinkOut - more resources
Full Text Sources
Other Literature Sources
Research Materials
