Clinical Trial
. 2015 Jun;33(6):610-6.
doi: 10.1038/nbt.3187. Epub 2015 May 25.

COMPASS identifies T-cell subsets correlated with clinical outcomes

Affiliations
Clinical Trial

COMPASS identifies T-cell subsets correlated with clinical outcomes

Lin Lin et al. Nat Biotechnol. 2015 Jun.

Abstract

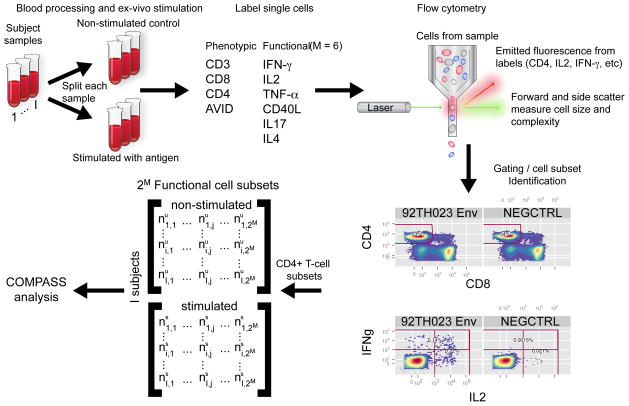
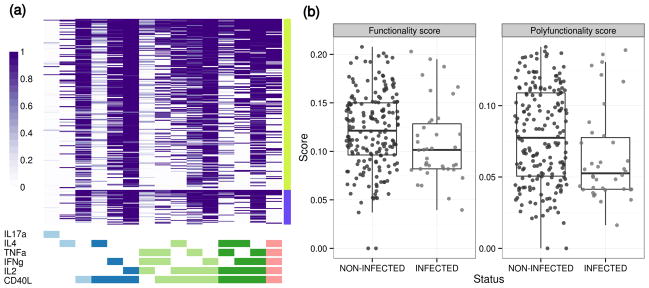
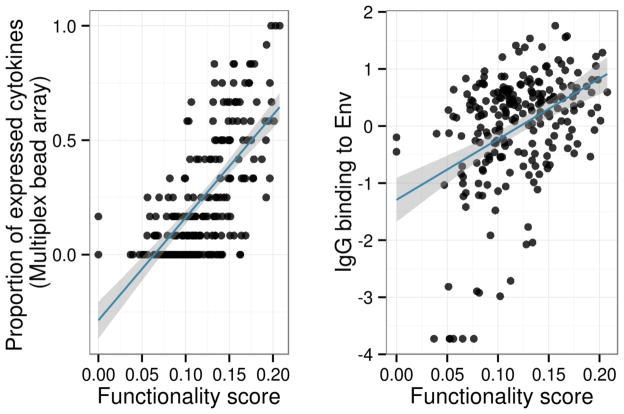
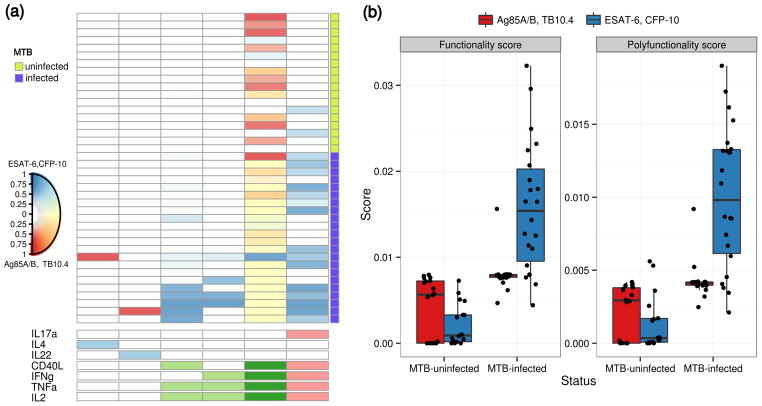
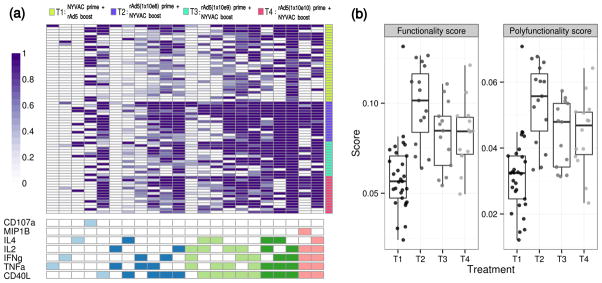
Advances in flow cytometry and other single-cell technologies have enabled high-dimensional, high-throughput measurements of individual cells as well as the interrogation of cell population heterogeneity. However, in many instances, computational tools to analyze the wealth of data generated by these technologies are lacking. Here, we present a computational framework for unbiased combinatorial polyfunctionality analysis of antigen-specific T-cell subsets (COMPASS). COMPASS uses a Bayesian hierarchical framework to model all observed cell subsets and select those most likely to have antigen-specific responses. Cell-subset responses are quantified by posterior probabilities, and human subject-level responses are quantified by two summary statistics that describe the quality of an individual's polyfunctional response and can be correlated directly with clinical outcome. Using three clinical data sets of cytokine production, we demonstrate how COMPASS improves characterization of antigen-specific T cells and reveals cellular 'correlates of protection/immunity' in the RV144 HIV vaccine efficacy trial that are missed by other methods. COMPASS is available as open-source software.


Figures

Figure 1
Figure 1
Overview of an ICS experiment. Blood samples are drawn from I subjects. A sample is split into aliquots that are subject to stimulation with antigen or are left non-stimulated as negative controls. After stimulation, whole PBMCs are labeled with fluorophore-conjugated antibodies against phenotypic (e.g. CD4, CD3, CD8, AVID/Live/Dead) and functional (e.g. IFNγ, IL2, TNFα, CD40L, IL17, IL4) markers (cells are permeabilized and intra-cellularly labeled for functional markers). The single-cell expression of each marker on each labeled cell is measured via flow cytometry, wherein cells pass in single-file through a flow cell and lasers of different wavelengths excite the fluorophores on the markers. A series of filters and detectors measure the emitted photons from the different fluorophores, providing a measure of intensity proportional to the amount of each protein expressed by each cell. After acquisition, data are processed and distinct cell populations of interest identified via a process termed ‘gating’, which describes identifying thresholds in multivariate space that classify each marker as either ‘positive’ (expressed) or ‘negative’ (not expressed). A COMPASS analysis assumes the ‘gating’ is given, and the COMPASS tool summarizes the number of cells expressing different combinatorial functional markers for specific phenotypic cell subsets (e.g. the number of CD4+ T cells expressing different combinations of cytokines). For M markers, this produces an I by 2M matrix of counts. COMPASS simultaneously models the counts for the paired stimulated and non-stimulated samples for each subject across all combinatorial functional cell subsets.
Figure 2
Figure 2
(a) Heatmap of COMPASS posterior probabilities for the RV144 data set. Columns correspond to the different cell subsets modeled by COMPASS (shown are the 15 of 24 subsets with detectable antigen-specific responses that had >5 cells in >2 subjects), color-coded by the cytokines they express (white=“off”, shaded=“on”, grouped by color=“degree of functionality”), and ordered by degree of functionality from one function on the left to five functions on the right. Subsets with maximum posterior probabilities less than 0.005 are removed from the heatmap. Rows correspond to subjects (only shown are 226 vaccine recipients), which are ordered by their status: non-infected and infected, and by functionality score within each group. Each cell shows the probability that the corresponding cell-subset (column) exhibits an Ag-specific response in the corresponding subject (row), where the probability is color-coded from white (zero) to purple (one). (b) Boxplots of functionality and polyfunctionality scores stratified by HIV infection status in RV144 among 226 vaccine recipients. Non-infected individuals have higher scores than infected ones (Wilcoxon test p = 0.03 (FS), p = 0.01 (PFS). Both scores are inversely correlated with infection (Table 1).
Figure 3
Figure 3
Functionality score vs. (a) proportion of expressed cytokines as measured by multiplex bead array and (b) IgG antibody binding in RV144. A set of 12 cytokines were measured by multiplex bead array. The proportion of detectable secreted cytokines was calculated in each individual and compared to the functionality score. The functionality score is significantly correlated with overall cytokine production (ρ=0.68, p-value < 2.2×10⁻¹⁶) and antibody binding (ρ=0.50, p-value=3.02×10⁻¹⁰). The fitted regression line from simple linear model is plotted in blue, and the 95% confidence interval is shown in grey.
Figure 4
Figure 4
(a) Heatmap of COMPASS posterior probabilities for the TB data set. Columns correspond to the different cell subsets modeled by COMPASS (shown are the six of 22 and 19 subsets with detectable antigen-specific response that had >5 cells in >2 subjects), color-coded by the cytokines they express (white=“off”, shaded=“on”, grouped by color=“degree of functionality”), and ordered by degree of functionality from one function on the left to five functions on the right. Subsets with maximum posterior probabilities less than 0.1 are removed from the heatmap Rows correspond to 40 subjects, which are ordered by level of interferon-gamma release as measured by Quantiferon Test (QFT). Subjects with positive QFT test results are labeled as TB positive. Each cell shows the probability that the corresponding cell-subset (column) exhibits an Ag-specific response in the corresponding subject (row), where the probability is color-coded from white (zero) to blue (one) for MTB-specific stimulation and red (one) for MTB-non-specific. A mix of blue and red (i.e. yellow) indicate a response to both stimulations. (b) Boxplots of functionality and polyfunctionality scores stratified by TB positive and TB negative for both TB-specific and non TB-specific stimulations.
Figure 5
Figure 5
(a) Heatmap of COMPASS posterior probabilities for the HVTN078 data. Columns correspond to the different cell subsets modeled by COMPASS (shown are the 22 of 26 subsets with detectable antigen-specific response and having >5 cells in >2 subjects), color-coded by the cytokines they express (white=“off”, shaded=“on”, color=“degree of functionality”), and ordered by degree of functionality from one function on the left to five functions on the right. Rows correspond to 71 subjects ordered by treatment group: T1: NYVAC+Ad5, T2–T4: increasing doses of Ad5+NYVAC, and by functionality score within each group. Each cell shows the probability that a given cell-subset (column) exhibits an Ag-specific response in the corresponding subject (column), where the probability is color-coded from white (zero) to purple (one). (b) Boxplots of functionality and polyfunctionality scores for CD4+ T cells stratified by treatment groups.

References

    1. De Rosa SC, Lu FX, Yu J, et al. Vaccination in humans generates broad T cell cytokine responses. [Accessed February 28, 2014];J Immunol. 2004 173(9):5372–80. Available at: http://www.ncbi.nlm.nih.gov/pubmed/15494483. - PubMed
    1. Attig S, Hennenlotter J, Pawelec G, et al. Simultaneous infiltration of polyfunctional effector and suppressor T cells into renal cell carcinomas. Cancer Res. 2009;69:8412–8419. doi: 10.1158/0008-5472.CAN-09-0852. - DOI - PubMed
    1. Rodrigue-Gervais IG, Rigsby H, Jouan L, et al. Dendritic cell inhibition is connected to exhaustion of CD8+ T cell polyfunctionality during chronic hepatitis C virus infection. [Accessed February 21, 2014];J Immunol. 2010 184(6):3134–44. Available at: http://www.ncbi.nlm.nih.gov/pubmed/20173023. - PubMed
    1. Ciuffreda D, Comte D, Cavassini M, et al. Polyfunctional HCV-specific T-cell responses are associated with effective control of HCV replication. [Accessed February 21, 2014];Eur J Immunol. 2008 38(10):2665–77. Available at: http://www.ncbi.nlm.nih.gov/pubmed/18958874. - PubMed
    1. Precopio ML, Betts MR, Parrino J, et al. Immunization with vaccinia virus induces polyfunctional and phenotypically distinctive CD8(+) T cell responses. J Exp Med. 2007;204(6):1405–1416. doi: 10.1084/jem.20062363. - DOI - PMC - PubMed

Publication types

MeSH terms