Multicenter Study
. 2015 Jul;16(7):755-65.
doi: 10.1038/ni.3175. Epub 2015 May 25.

Diversity, cellular origin and autoreactivity of antibody-secreting cell population expansions in acute systemic lupus erythematosus

Affiliations
Multicenter Study

Diversity, cellular origin and autoreactivity of antibody-secreting cell population expansions in acute systemic lupus erythematosus

Christopher M Tipton et al. Nat Immunol. 2015 Jul.

Abstract

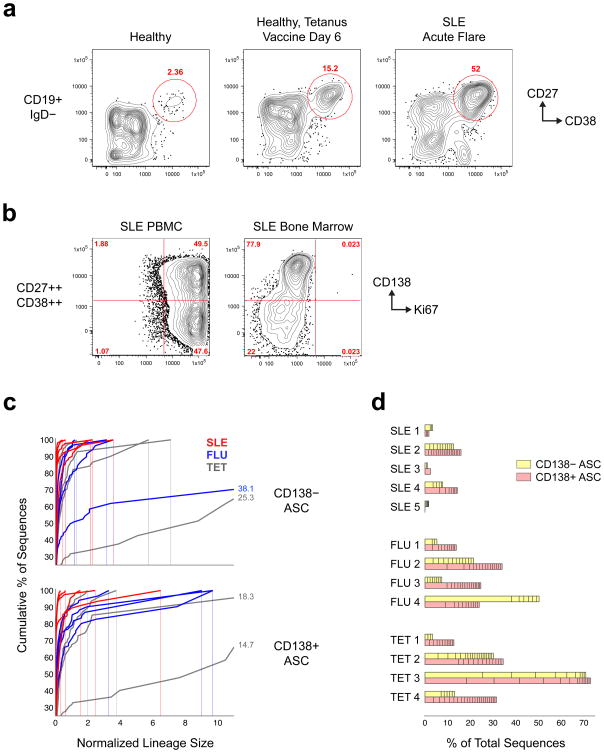
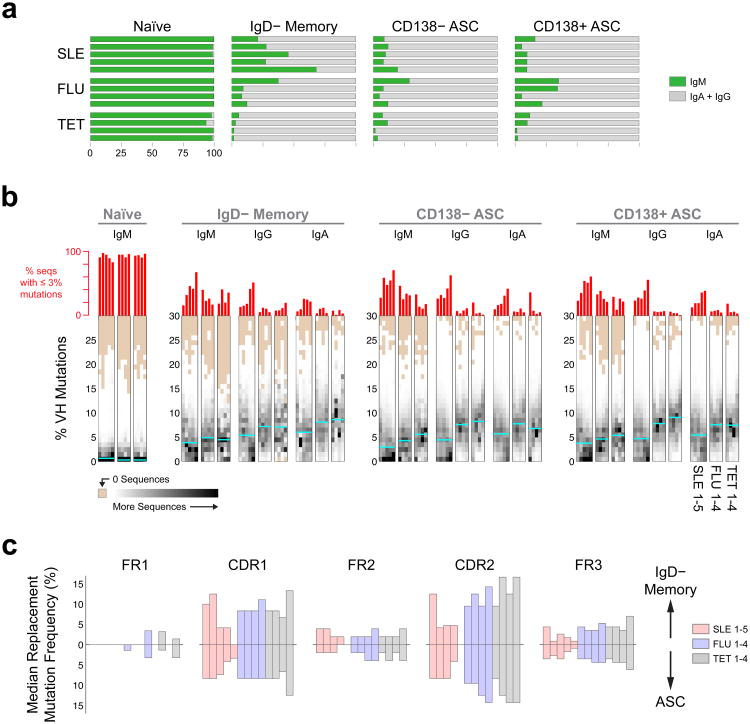
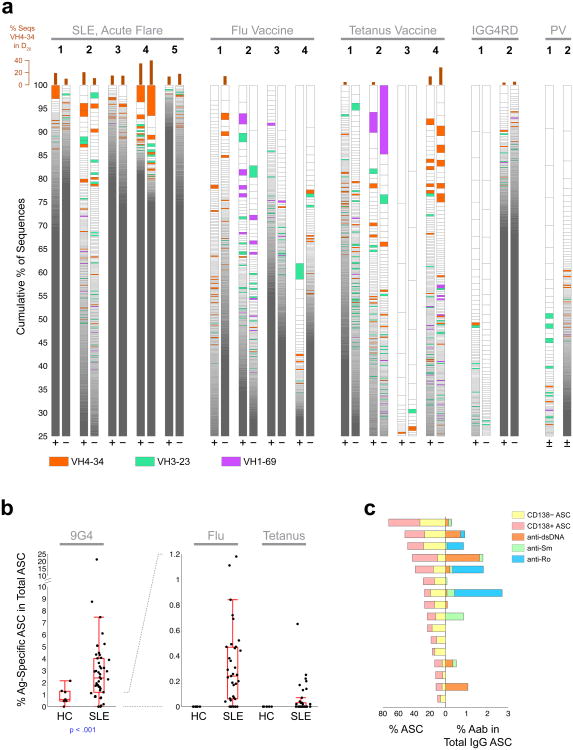
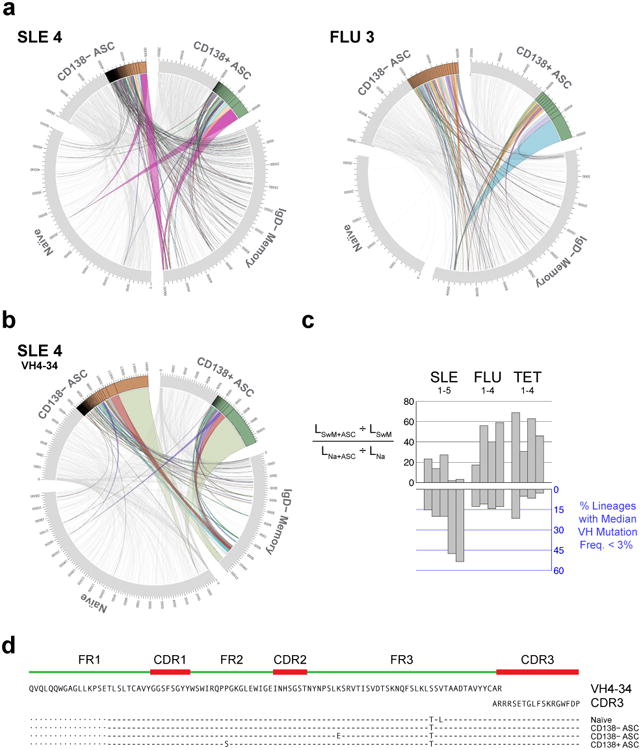
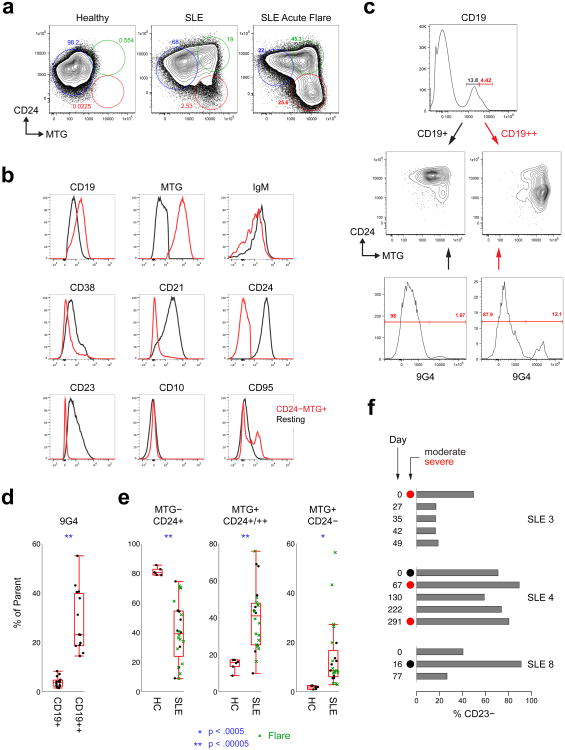
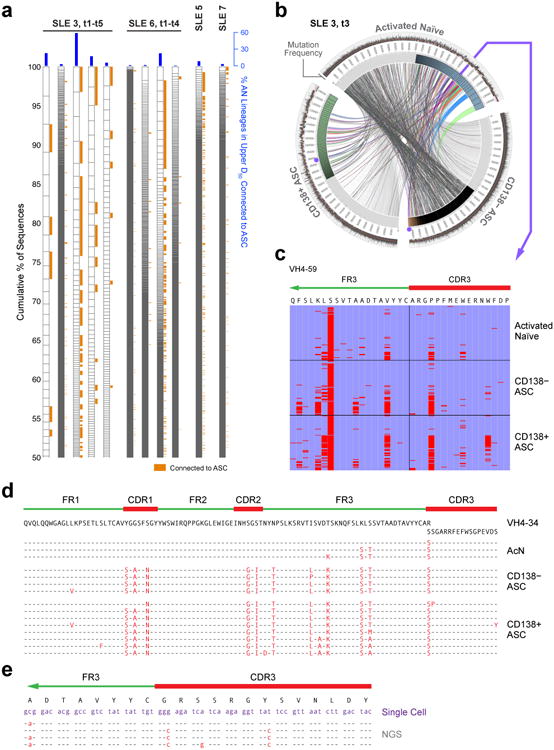
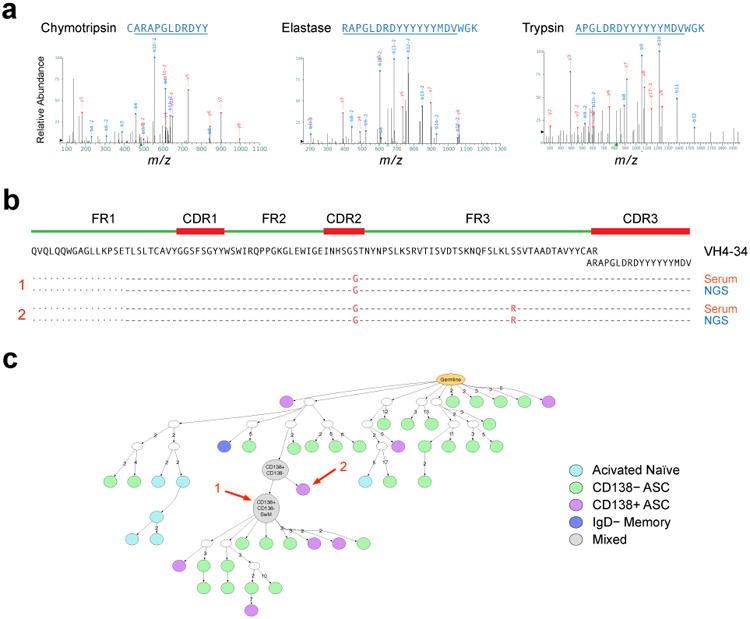
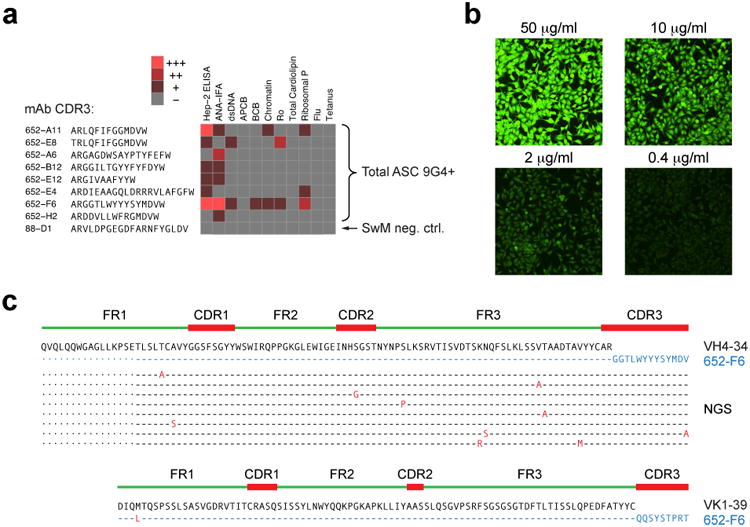
Acute systemic lupus erythematosus (SLE) courses with surges of antibody-secreting cells (ASCs) whose origin, diversity and contribution to serum autoantibodies remain unknown. Here, deep sequencing, proteomic profiling of autoantibodies and single-cell analysis demonstrated highly diversified ASCs punctuated by clones expressing the variable heavy-chain region VH4-34 that produced dominant serum autoantibodies. A fraction of ASC clones contained autoantibodies without mutation, a finding consistent with differentiation outside the germinal centers. A substantial ASC segment was derived from a distinct subset of newly activated naive cells of considerable clonality that persisted in the circulation for several months. Thus, selection of SLE autoreactivities occurred during polyclonal activation, with prolonged recruitment of recently activated naive B cells. Our findings shed light on the pathogenesis of SLE, help explain the benefit of agents that target B cells and should facilitate the design of future therapies.


Figures

Figure 1
Figure 1. SLE flares are characterized by large polyclonal expansions of ASCs
(a) Polychromatic flow cytometric analysis of SLE flares compared to healthy controls at steady-state and post-vaccination. Representative plots are shown for each state. ASC expansions are documented as the CD27hiCD38hi fraction of IgD CD19+ B cells. (b) Ki67 staining of peripheral blood ASCs in SLE flares compared to SLE bone marrow ASCs. (c) Clonality of ASCs determined by NGS displayed by size-ranking of individual clonotypes from bottom (smallest) to top (largest) along the extent of the y-axis representing 100% of all the sequences. The x-axis is the normalized lineage size (percentage of the total number of sequences). 2 tetanus and 1 influenza vaccination samples (Tet-2, -3, and Flu 4) are off x-axis scale; maximum lineage size is indicated for these samples to the right of the curve. (d) Size-ranked clones larger than the first occurrence where difference in normalized size of adjacent clones exceeds a threshold value of 0.1% are plotted against the % of all ASC sequences. (n = 5 SLE, 8 vaccination samples; P < 0.05 t-test with unequal variances).
Figure 2
Figure 2. Isotype distribution and somatic mutation in SLE and healthy vaccinated controls
(a) Stacked plots indicate proportion of switched (IgG + IgA) and unswitched (IgM) sequences for 13 samples (rows) and four cell subsets (columns). IgD memory cells include both isotype-switched and IgM-only cells. The IgM-only fraction of memory cells is significantly increased in SLE (p < 0.05, t-test with unequal variances). (b) Heat map histograms of mutation rates for 4 populations, 3 isotypes and 13 subjects. Columns represent a single isotype and population from an individual. Rows are histogram bins representing percent V mutations (bin size is 1%). Shades of gray correspond to bin height (beige corresponds to “0”). Bin heights for each histogram were divided by the total number of sequences for the corresponding isotype/population/individual to normalize the histogram heights and so histogram bin heights sum to 1. Cyan lines show the average of medians for each sample group. SLE ASC fractions displayed a lower average mutation rate compared to vaccinated HC (p < 0.05, t-test unequal variances). Red bars above plots indicate percentage of sequences with mutation rates below 3% and show a significantly higher number of these low-mutated sequences in SLE ASC (p < 0.05, t-test with unequal variances). (c) Replacement mutations (median frequency) found in each region in IgD Memory (top) and CD138+/- ASC (bottom).
Figure 3
Figure 3. Over-representation of IGHV4-34 among SLE ASC clonal expansions
(a) Plots showing size distribution of individual clonotypes for 17 samples with large IGHV4-34 clones depicted as red bins. For each subject, clonality is depicted for both CD138 ASC (“−”), and CD138+ ASC (“+”). Within each bar, lineages are ordered by size from bottom to top and delineated by horizontal lines. Selected VH-genes (where the normalized lineage size is greater than 0.1% of total sequences) are shown in colors. Bar graphs above the lineage plots show the percentage of sequences in the largest 20% of clones that were IGHV4-34, which was significantly higher in SLE (p < 0.01, Wilcoxon rank sum test). (b) Elispot analysis of antigen-specific ASC. Frequencies of 9G4, Flu, and Tetanus responses are shown as % of total IgG spots. Boxes are 25th to 75th percentiles, lines in boxes are medians, whiskers show extent of non-outlier data (outliers are 1.5 times the interquartile range beyond 25th or 75th percentiles). Note different scales for 9G4 and Flu, Tetanus. (c) Autoantibody frequency (as determined by Elispot), in SLE patients with large increases of ASC (>10% of CD38++CD27++ of IgDCD19+ cells). Left horizontal bars: frequency of CD138 and CD138+ ASC in individual SLE patients (n=16); right horizontal bars: corresponding percentages of autoantibody specificity out of total IgG ASC.
Figure 4
Figure 4. Contribution of naive cells to ASC in SLE flares
(a) Circos plots integrating multiple molecular features of the antibody repertoire are shown for representative SLE and post-vaccination samples. Plots include the 4 sorted B cell and ASC populations. Sequences numbers are displayed in the outer track; the next track illustrates clonal size and the inner space illustrates connections between populations. Two samples (SLE and day 7 influenza vaccinated subjects) are plotted. Sequences comprising the D50 component of the corresponding population (sequences within the top 50%) are shown in grey for ASC populations whereas lineages accounting for the D20 segment (the top 20% of sequences) and their connections are highlighted in color. All naïve and IgD memory sequences were highly polyclonal and are depicted in grey. Only connections from naïve and/or IgD memory to ASC are shown. These plots demonstrate the naïve derivation in SLE of several top D20 CD138 and CD138+ ASC clones including the largest one. (b) A similar contribution of naïve cells to D20 VH4-34 ASC, including the largest clone, is demonstrated for SLE 4 using Circos plots limited to VH4-34 sequences. (c) Top: Comparison of the relatedness of ASC to naïve and SwM. Score is the ratio of the fraction of all SwM clonotypes that are connected to ASC, to the fraction of all naïve lineages connected to ASC. Bottom: percentage of ASC lineages with median mutation frequency < 3%. (d) Alignment of sequences from the largest clone identified in SLE4. Sequences from Naive and ASC share the same HCDR3 and nearly identical VH, and JH regions.
Figure 5
Figure 5. Characterization of activated naïve B cells in SLE
(a) Fractionation of CD19+ IgD+ CD27 cells in active flaring SLE patients identifies three distinct subsets using MTG and CD24 staining. SLE patients have significant expansions of a novel population of MTG+ CD24 cells which may become dominant in actively flaring patients (green symbols in e). These plots are representative of the full data set in e. (b) Extended phenotype of activated (IgD+ CD27 MTG+ CD24; red histograms) compared to resting naïve B cells (IgD CD27+ MTG CD24+; black histogram). (c) The CD19++ fraction of total CD19+ B cells corresponds with the MTG+ CD24- population and is highly enriched in 9G4+ cells relative to the MTG+/- CD24+ fractions. These plots are representative of the full data set in d. (d) The frequency of autoreactive 9G4+ B cells is highly increased within the activated CD19++ fraction of IgD+ CD27 relative to resting CD19+ cells. (e) MTG+ CD24 cells are greatly expanded in flaring SLE subjects. Boxes are 25th to 75th percentiles, lines in boxes are medians, bars show extent of non-outlier data (outliers are 1.5 times the interquartile range beyond 25th or 75th percentiles. (f) Activated cells (in these particular examples identified as the % of CD23 within the IgD+ CD27 naïve cells) were dominant within the naïve compartment during active moderate/severe flares in patients analyzed longitudinally. In one SLE patient (SLE 4), these cells persisted at very high levels between consecutive flares in the context of persistent disease activity by Physician Global Assessment.
Figure 6
Figure 6. Clonality and connectivity of activated naïve B cells in SLE
(a) NGS data are displayed as in Fig. 3a to illustrate the clonality of activated naïve cells for four SLE patients, of whom two were analyzed at multiple time points (t1-t5 over 8 weeks for SLE-3 and t1-t4 over 4 weeks for SLE-6). Orange tabs indicate lineages connected to ASC. Blue bars indicate % of acN lineages connected to ASC. (b) Circos plot illustrating clonal expansions and high clonal lineage connectivity of activated naïve cells (IgD+ CD27+ MTG+ CD24) with ASC populations during SLE flare for the third time point for patient SLE 3. The innermost track indicates the clonality for each population (only highlighted for the top 50% of sequences). The outermost track shows mutation frequencies for the constituent sequences. (c) Alignment of a representative clone containing sequences found in activated naïve, CD138 ASC and CD138+ ASC. The alignment was made to the corresponding germline sequence (VH4-59) and to the CDR3 contained in the sequence with the least VH mutations (common ancestor). Red bars indicate mismatches from the reference sequences. This lineage is highlighted in Fig. 6b as purple dots for the two ASC populations and the arrow for activated naïve cells. (d) Sequence alignment illustrating the co-existence of unmutated/low-mutated acN sequences and highly mutated ASC sequences within a large VH4-34 clone from SLE-6 at a single time point. (e) Sequence alignment of single cell sequences obtained from acN cells and clonally related ASC sequences derived from ASC sequences by NGS 4 months earlier at the time of flare (SLE-3).
Figure 7
Figure 7. Serological consequence and cellular derivation of expanded ASC clones in SLE
(a) Proteomic analysis of affinity-purified serum 9G4 antibodies from SLE-3. Multiple proteolytic digestions resulted in spectra of overlapping peptides spanning the HCDR3 sequence ARAPGLDRDYYYYYYMDV. (b) As illustrated in the alignment, this HCDR3 sequence and two linked full-length VH sequences (separated by a single point mutation) also identified by proteomics, were a perfect match for two ASC sequences identified by NGS in the same blood sample. As illustrated in Supplemental Figure 6, this sequence was consistently found in longitudinal serum and ASC samples. (c) IgTree-based phylogenetic analysis was used to localize the ASC origin of the serum antibody within the largest VH4-34 clone present in SLE 3 at the early flare time point. The arrows mark the exact sequences found by proteomic analysis of patient serum.
Figure 8
Figure 8. Autoreactivity of 9G4 ASC in SLE
9G4+ ASC were sorted from SLE subject 3 four months after flare and H and L chains expressed by single cells were sequenced. (a) Autoreactivity profile of selected mAbs mAbs is shown using a heat map display. ANA, dsDNA, Chromatin, Ro, Cardiolipin, and Ribosomal P reactivity as well as apoptotic cell binding and B cell binding were measured as described . ANA was tested by both Hep-2 immunofluorescence (ANA-IFA) and ELISA (Hep-2 ELISA). mAb 652-F6, representing a highly expanded clone found in subject SLE3 at flare, also shows strong auto-polyreactivity. (b) 652-F6 generated strong, dose-dependent ANA-IFA autoreactivity with strong nucleolar staining and homogeneous cytoplasmic staining consistent with anti-ribosomal reactivity also seen by ELISA. (c) 652-F6 expressed a completely unmutated VH4-34 variable region and unmutated light chain. Its VH sequence belonged to a large clonal tree identified by NGS of bulk ASC 4 months prior to the single cell analysis. ASC clonally related sequences are shown in the alignment to illustrate intraclonal diversification despite the persistence of unmutated clonal members in the circulation.

Comment in

References

    1. Lee FE, et al. Circulating human antibody-secreting cells during vaccinations and respiratory viral infections are characterized by high specificity and lack of bystander effect. J Immunol. 2011;186:5514–5521. doi: 10.4049/jimmunol.1002932. - DOI - PMC - PubMed
    1. Wrammert J, et al. Rapid cloning of high-affinity human monoclonal antibodies against influenza virus. Nature. 2008;453:667–671. doi: 10.1038/nature06890. - DOI - PMC - PubMed
    1. Odendahl M, et al. Disturbed peripheral B lymphocyte homeostasis in systemic lupus erythematosus. J Immunol. 2000;165:5970–5979. doi: 10.4049/jimmunol.165.10.5970. - DOI - PubMed
    1. Cappione A, 3rd, et al. Germinal center exclusion of autoreactive B cells is defective in human systemic lupus erythematosus. J Clin Invest. 2005;115:3205–3216. doi: 10.1172/JCI24179. - DOI - PMC - PubMed
    1. Isenberg DA, et al. Correlation of 9G4 idiotope with disease activity in patients with systemic lupus erythematosus. Ann Rheum Dis. 1998;57:566–570. doi: 10.1136/ard.57.9.566. - DOI - PMC - PubMed

Publication types

MeSH terms