

Bronchial lesions of mouse model of asthma are preceded by immune complex vasculitis and induced bronchial associated lymphoid tissue (iBALT)
- PMID: 26006019
- PMCID: PMC4520747
- DOI: 10.1038/labinvest.2015.72
Bronchial lesions of mouse model of asthma are preceded by immune complex vasculitis and induced bronchial associated lymphoid tissue (iBALT)
Abstract
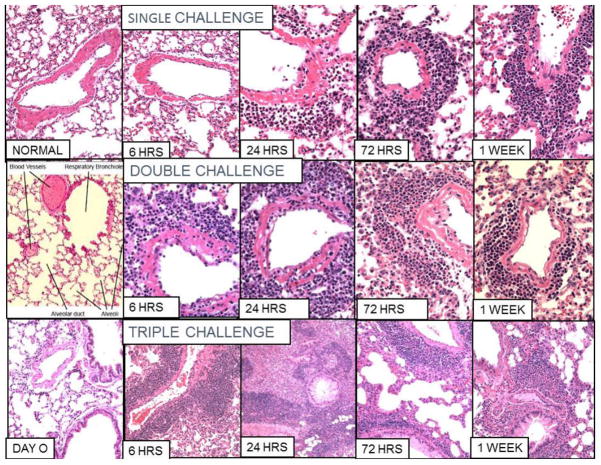
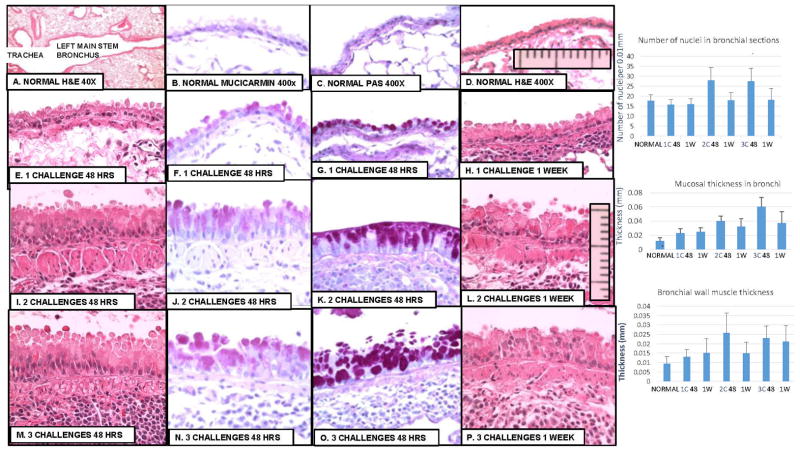
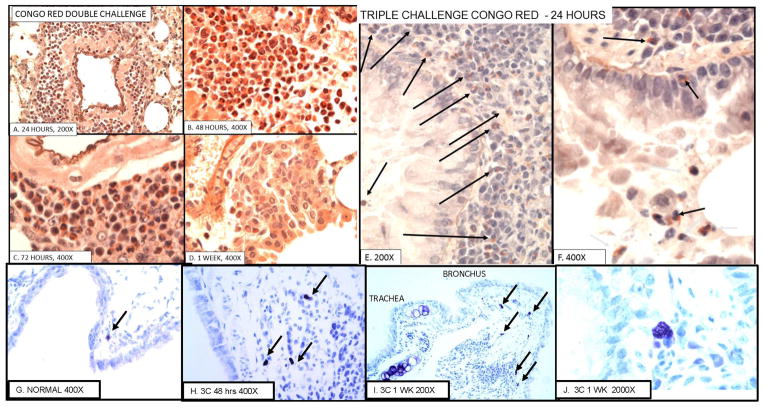
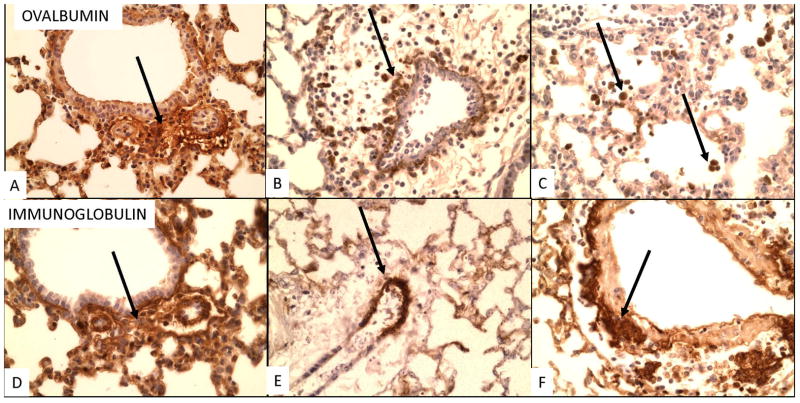
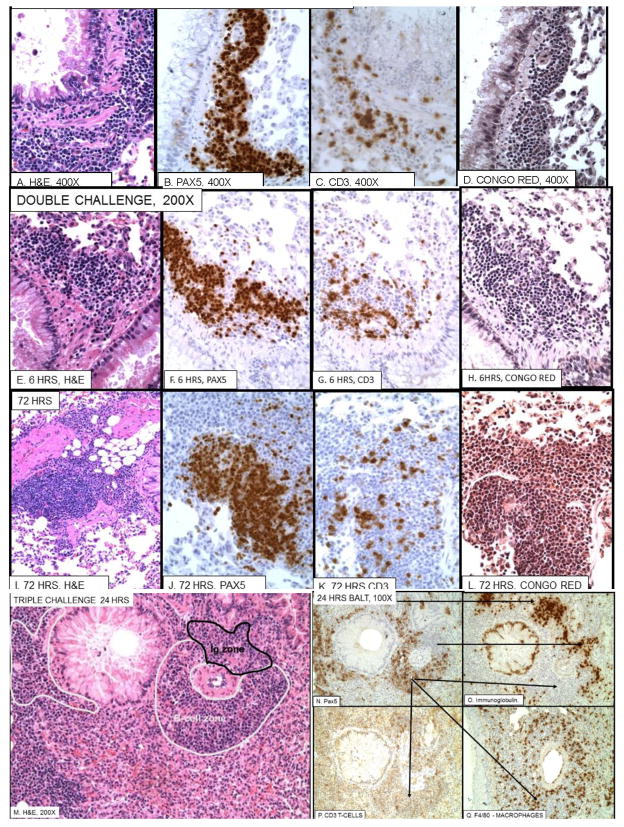
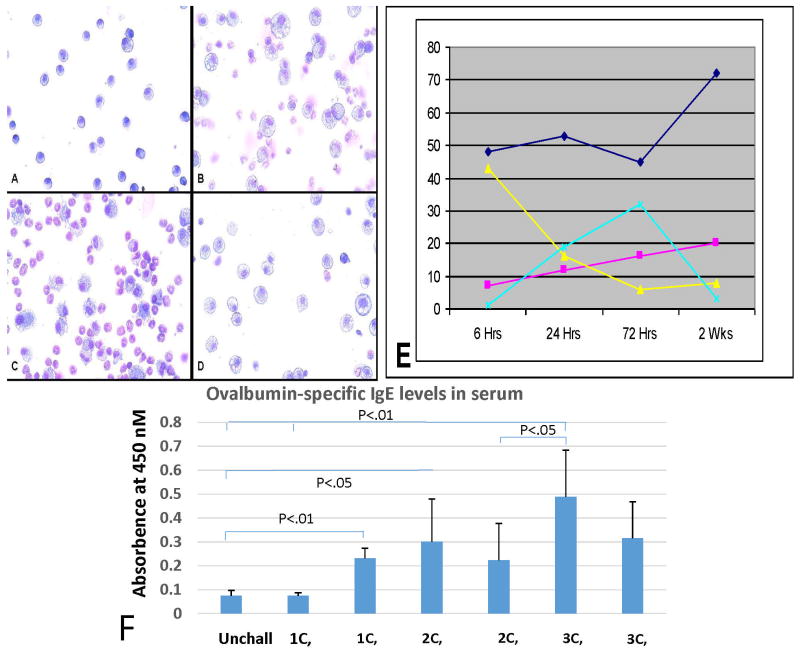
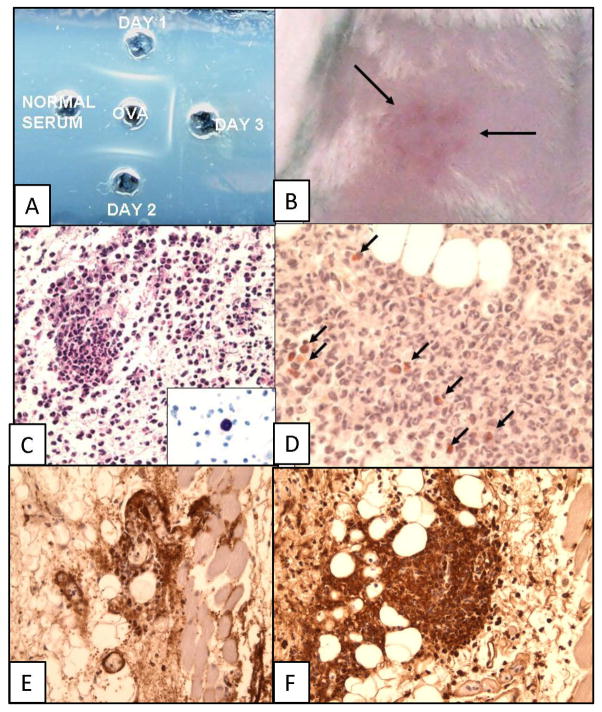
We systematically examined by immune histology the lungs of some widely used mouse models of asthma. These models include sensitization by multiple intraperitoneal injections of soluble ovalbumin (OVA) or of OVA with alum, followed by three intranasal or aerosol challenges 3 days apart. Within 24 h after a single challenge there is fibrinoid necrosis of arterial walls with deposition of immunoglobulin (Ig) and OVA and infiltration of eosinophilic polymorphonuclear cells that lasts for about 3 days followed by peribronchial B-cell infiltration and slight reversible goblet cell hypertrophy (GCHT). After two challenges, severe eosinophilic vasculitis is present at 6 h, increases by 72 h, and then declines; B-cell proliferation and significant GCHT and hyperplasia (GCHTH) and bronchial smooth muscle hypertrophy recur more prominently. After three challenges, there is significantly increased induced bronchus-associated lymphoid tissue (iBALT) formation, GCHTH, and smooth muscle hypertrophy. Elevated levels of Th2 cytokines, IL-4, IL-5, and IL-13, are present in bronchial lavage fluids. Sensitized mice have precipitating antibody and positive Arthus skin reactions but also develop significant levels of IgE antibody to OVA but only 1 week after challenge. We conclude that the asthma like lung lesions induced in these models is preceded by immune complex-mediated eosinophilic vasculitis and iBALT formation. There are elevations of Th2 cytokines that most likely produce bronchial lesions that resemble human asthma. However, it is unlikely that mast cell-activated atopic mechanisms are responsible as we found only a few presumed mast cells by toluidine blue and metachromatic staining limited to the most proximal part of the main stem bronchus, and none in the remaining main stem bronchus or in the lung periphery.
Conflict of interest statement
The authors declare that they have no conflicts of interest.
Figures
Similar articles
-
4-1 BB stimulation inhibits allergen-specific immunoglobulin E production and airway hyper-reactivity but partially suppresses bronchial eosinophilic inflammation in a mouse asthma model.Clin Exp Allergy. 2006 Mar;36(3):377-85. doi: 10.1111/j.1365-2222.2006.02445.x. Clin Exp Allergy. 2006. PMID: 16499650
-
Pulmonary eosinophilia correlates with allergen deposition to the lower respiratory tract in a mouse model of asthma.Clin Exp Allergy. 2008 Aug;38(8):1381-90. doi: 10.1111/j.1365-2222.2008.03009.x. Epub 2008 Jun 4. Clin Exp Allergy. 2008. PMID: 18537985
-
Phospholipase cε, an effector of ras and rap small GTPases, is required for airway inflammatory response in a mouse model of bronchial asthma.PLoS One. 2014 Sep 30;9(9):e108373. doi: 10.1371/journal.pone.0108373. eCollection 2014. PLoS One. 2014. PMID: 25269075 Free PMC article.
-
Role of IgE in the development of allergic airway inflammation and airway hyperresponsiveness--a murine model.Allergy. 1999 Apr;54(4):297-305. doi: 10.1034/j.1398-9995.1999.00085.x. Allergy. 1999. PMID: 10371087 Review.
-
Epithelial barrier function and immunity in asthma.Ann Am Thorac Soc. 2014 Dec;11 Suppl 5:S244-51. doi: 10.1513/AnnalsATS.201407-304AW. Ann Am Thorac Soc. 2014. PMID: 25525727 Review.
Cited by
-
Immunopathology of Experimental Models of Syphilis, Influenza, and Asthma.For Immunopathol Dis Therap. 2016;7(3-4):225-236. doi: 10.1615/ForumImmunDisTher.2017020136. For Immunopathol Dis Therap. 2016. PMID: 29876142 Free PMC article.
-
Immunological association of inducible bronchus-associated lymphoid tissue organogenesis in Ag85B-rHPIV2 vaccine-induced anti-tuberculosis mucosal immune responses in mice.Int Immunol. 2018 Sep 25;30(10):471-481. doi: 10.1093/intimm/dxy046. Int Immunol. 2018. PMID: 30011025 Free PMC article.
-
Impaired airway mucociliary function reduces antigen-specific IgA immune response to immunization with a claudin-4-targeting nasal vaccine in mice.Sci Rep. 2018 Feb 13;8(1):2904. doi: 10.1038/s41598-018-21120-7. Sci Rep. 2018. PMID: 29440671 Free PMC article.
-
Role of iBALT in Respiratory Immunity.Curr Top Microbiol Immunol. 2020;426:21-43. doi: 10.1007/82_2019_191. Curr Top Microbiol Immunol. 2020. PMID: 31974759 Free PMC article. Review.
-
Role of chemical composition and redox modification of poorly soluble nanomaterials on their ability to enhance allergic airway sensitisation in mice.Part Fibre Toxicol. 2019 Oct 28;16(1):39. doi: 10.1186/s12989-019-0320-6. Part Fibre Toxicol. 2019. PMID: 31660999 Free PMC article.
References
-
- Nakajima H, Iwamoto I, Tomoe S, et al. CD4+ T-lymphocytes and interleukin-5 mediate antigen-induced eosinophil infiltration into the mouse trachea. The American review of respiratory disease. 1992;146(2):374–377. - PubMed
-
- Cohn L. Food for thought: can immunological tolerance be induced to treat asthma? Am J Respir Cell Mol Biol. 2001;24(5):509–512. - PubMed
-
- Zosky GR, Sly PD. Animal models of asthma. Clin Exp Allergy. 2007;37(7):973–988. - PubMed
MeSH terms
Substances
Grants and funding
LinkOut - more resources
Full Text Sources
Other Literature Sources
Medical
