

A Unified Probabilistic Framework for Dose-Response Assessment of Human Health Effects
- PMID: 26006063
- PMCID: PMC4671238
- DOI: 10.1289/ehp.1409385
A Unified Probabilistic Framework for Dose-Response Assessment of Human Health Effects
Abstract
Background: When chemical health hazards have been identified, probabilistic dose-response assessment ("hazard characterization") quantifies uncertainty and/or variability in toxicity as a function of human exposure. Existing probabilistic approaches differ for different types of endpoints or modes-of-action, lacking a unifying framework.
Objectives: We developed a unified framework for probabilistic dose-response assessment.
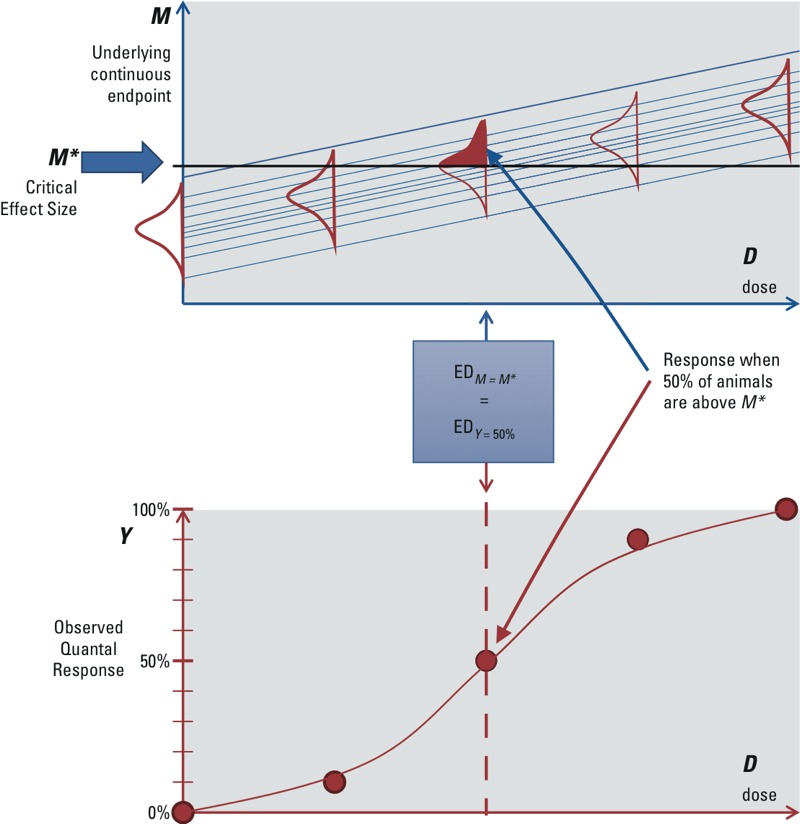
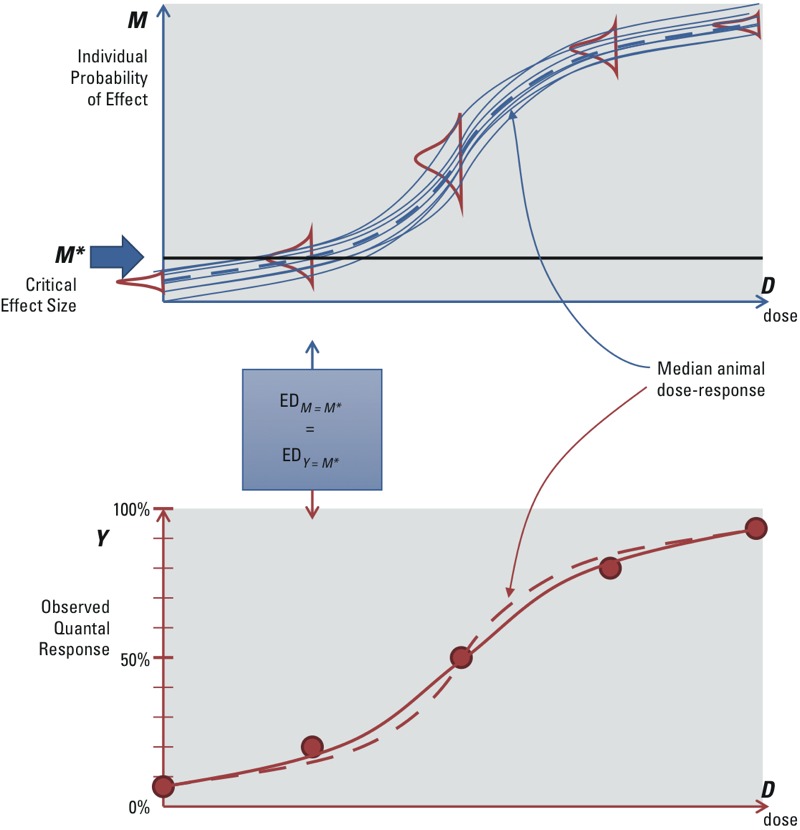
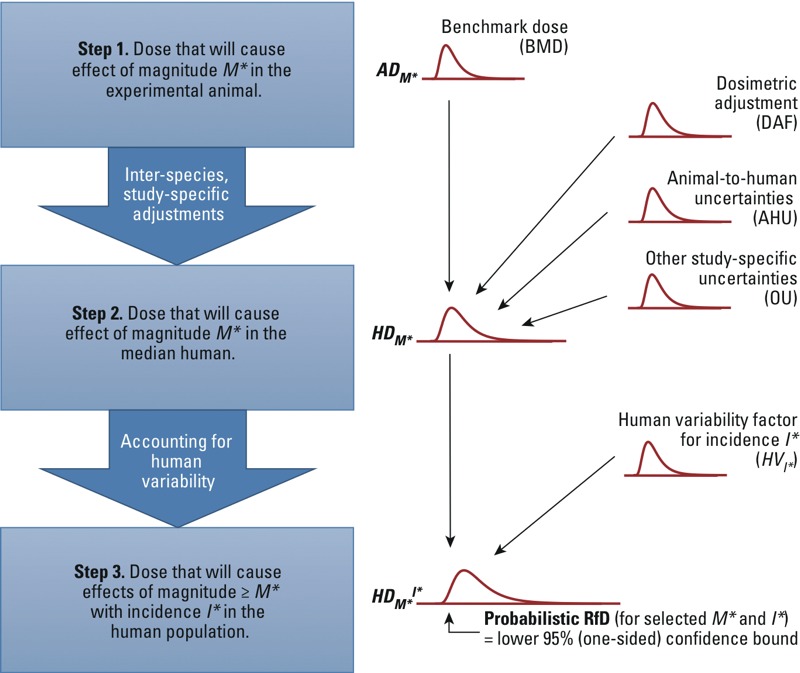
Methods: We established a framework based on four principles: a) individual and population dose responses are distinct; b) dose-response relationships for all (including quantal) endpoints can be recast as relating to an underlying continuous measure of response at the individual level; c) for effects relevant to humans, "effect metrics" can be specified to define "toxicologically equivalent" sizes for this underlying individual response; and d) dose-response assessment requires making adjustments and accounting for uncertainty and variability. We then derived a step-by-step probabilistic approach for dose-response assessment of animal toxicology data similar to how nonprobabilistic reference doses are derived, illustrating the approach with example non-cancer and cancer datasets.
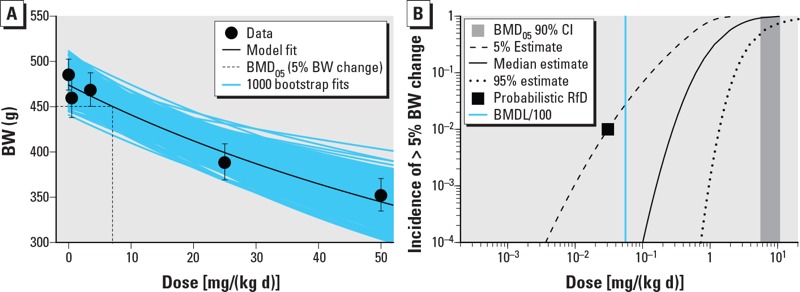
Results: Probabilistically derived exposure limits are based on estimating a "target human dose" (HDMI), which requires risk management-informed choices for the magnitude (M) of individual effect being protected against, the remaining incidence (I) of individuals with effects ≥ M in the population, and the percent confidence. In the example datasets, probabilistically derived 90% confidence intervals for HDMI values span a 40- to 60-fold range, where I = 1% of the population experiences ≥ M = 1%-10% effect sizes.
Conclusions: Although some implementation challenges remain, this unified probabilistic framework can provide substantially more complete and transparent characterization of chemical hazards and support better-informed risk management decisions.
Conflict of interest statement
The views expressed here do not necessarily represent those of the U.S. Environmental Protection Agency.
The authors declare they have no actual or potential competing financial interests.
Figures
Similar articles
-
Beyond the RfD: Broad Application of a Probabilistic Approach to Improve Chemical Dose-Response Assessments for Noncancer Effects.Environ Health Perspect. 2018 Jun 28;126(6):067009. doi: 10.1289/EHP3368. eCollection 2018 Jun. Environ Health Perspect. 2018. PMID: 29968566 Free PMC article.
-
APROBA-Plus: A probabilistic tool to evaluate and express uncertainty in hazard characterization and exposure assessment of substances.Food Chem Toxicol. 2017 Dec;110:408-417. doi: 10.1016/j.fct.2017.10.038. Epub 2017 Oct 23. Food Chem Toxicol. 2017. PMID: 29074418 Free PMC article.
-
Application of probabilistic methods to address variability and uncertainty in estimating risks for non-cancer health effects.Environ Health. 2023 Jan 12;21(Suppl 1):129. doi: 10.1186/s12940-022-00918-z. Environ Health. 2023. PMID: 36635712 Free PMC article.
-
Recent Advances in Probabilistic Dose-Response Assessment to Inform Risk-Based Decision Making.Risk Anal. 2021 Apr;41(4):596-609. doi: 10.1111/risa.13595. Epub 2020 Sep 23. Risk Anal. 2021. PMID: 32966629 Free PMC article. Review.
-
Probabilistic exposure analysis for chemical risk characterization.Toxicol Sci. 2009 May;109(1):4-17. doi: 10.1093/toxsci/kfp036. Epub 2009 Feb 17. Toxicol Sci. 2009. PMID: 19223660 Free PMC article. Review.
Cited by
-
Human Chemical Exposure from Background Emissions in the United States and the Implication for Quantifying Risks from Marginal Emission Increase.Toxics. 2021 Nov 15;9(11):308. doi: 10.3390/toxics9110308. Toxics. 2021. PMID: 34822699 Free PMC article.
-
Reducing uncertainty in dose-response assessments by incorporating Bayesian benchmark dose modeling and in vitro data on population variability.Risk Anal. 2025 Feb;45(2):457-472. doi: 10.1111/risa.17451. Epub 2024 Aug 16. Risk Anal. 2025. PMID: 39148436 Free PMC article.
-
Application of a unified probabilistic framework to the dose-response assessment of acrolein.Environ Int. 2020 Oct;143:105953. doi: 10.1016/j.envint.2020.105953. Epub 2020 Aug 5. Environ Int. 2020. PMID: 32768806 Free PMC article.
-
Exposure and Toxicity Characterization of Chemical Emissions and Chemicals in Products: Global Recommendations and Implementation in USEtox.Int J Life Cycle Assess. 2021 May;26(5):899-915. doi: 10.1007/s11367-021-01889-y. Epub 2021 Apr 5. Int J Life Cycle Assess. 2021. PMID: 34140756 Free PMC article.
-
A Web-Based System for Bayesian Benchmark Dose Estimation.Environ Health Perspect. 2018 Jan 11;126(1):017002. doi: 10.1289/EHP1289. Environ Health Perspect. 2018. PMID: 29329100 Free PMC article.
References
-
- Abt E, Rodricks JV, Levy JI, Zeise L, Burke TA. Science and decisions: advancing risk assessment. Risk Anal. 2010;30(7):1028–1036. - PubMed
-
- Bailer AJ, Noble RB, Wheeler MW. Model uncertainty and risk estimation for experimental studies of quantal responses. Risk Anal. 2005;25(2):291–299. - PubMed
-
- Baird SJS, Cohen JT, Graham JD, Shlyakter AI, Evans JS. Noncancer risk assessment: a probabilistic alternative to current practice. Hum Ecol Risk Assess. 1996;2(1):70–102.
-
- Barlow S, Renwick AG, Kleiner J, Bridges JW, Busk L, Dybing E, et al. Risk assessment of substances that are both genotoxic and carcinogenic report of an International Conference organized by confidence intervals CIs and WHO with support of ILSI Europe. Food Chem Toxicol. 2006;44:1636–1650. - PubMed
Publication types
MeSH terms
Substances
LinkOut - more resources
Full Text Sources
Other Literature Sources
