

Optimal Scanning Protocols for Dual-Energy CT Angiography in Peripheral Arterial Stents: An in Vitro Phantom Study
- PMID: 26006234
- PMCID: PMC4463716
- DOI: 10.3390/ijms160511531
Optimal Scanning Protocols for Dual-Energy CT Angiography in Peripheral Arterial Stents: An in Vitro Phantom Study
Abstract
Objective: To identify the optimal dual-energy computed tomography (DECT) scanning protocol for peripheral arterial stents while achieving a low radiation dose, while still maintaining diagnostic image quality, as determined by an in vitro phantom study.
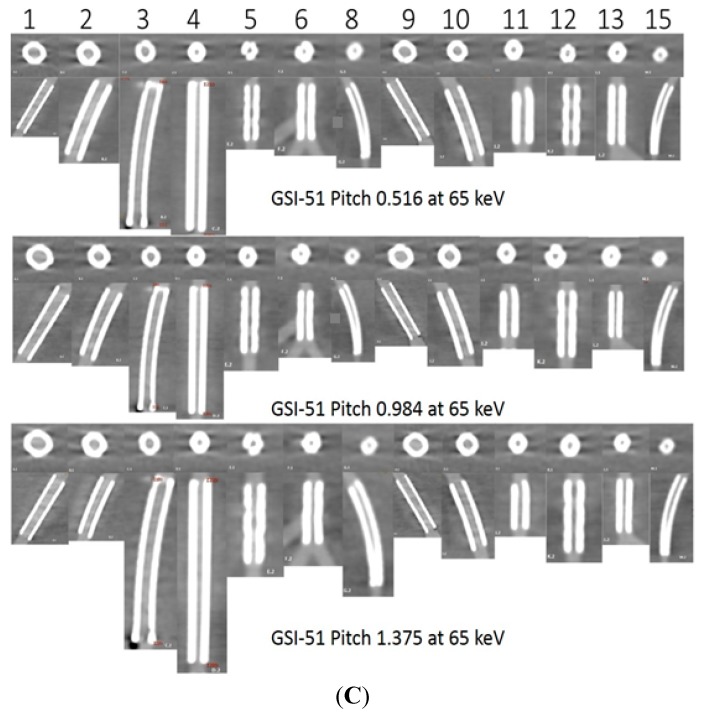
Methods: Dual-energy scans in monochromatic spectral imaging mode were performed on a peripheral arterial phantom with use of three gemstone spectral imaging (GSI) protocols, three pitch values, and four kiloelectron volts (keV) ranges. A total of 15 stents of different sizes, materials, and designs were deployed in the phantom. Image noise, the signal-to-noise ratio (SNR), different levels of adaptive statistical iterative reconstruction (ASIR), and the four levels of monochromatic energy for DECT imaging of peripheral arterial stents were measured and compared to determine the optimal protocols.
Results: A total of 36 scans with 180 datasets were reconstructed from a combination of different protocols. There was a significant reduction of image noise with a higher SNR from monochromatic energy images between 65 and 70 keV in all investigated preset GSI protocols (p < 0.05). In addition, significant effects were found from the main effect analysis for these factors: GSI, pitch, and keV (p = 0.001). In contrast, there was significant interaction on the unstented area between GSI and ASIR (p = 0.015) and a very high significant difference between keV and ASIR (p < 0.001). A radiation dose reduction of 50% was achieved.
Conclusions: The optimal scanning protocol and energy level in the phantom study were GSI-48, pitch value 0.984, and 65 keV, which resulted in lower image noise and a lower radiation dose, but with acceptable diagnostic images.
Keywords: dual-energy CT; gemstone spectral imaging; image noise; monochromatic image; peripheral arterial stent.
Figures


References
-
- Rosamond W., Flegal K., Furie K., Go A., Greenlund K., Haase N., Hailpern S.M., Ho M., Howard V., Kissela B., et al. Heart disease and stroke statistics—2008 update: A report from the American Heart Association Statistics Committee and Stroke Statistics Subcommittee. Circulation. 2008;117:e25–e146. doi: 10.1161/CIRCULATIONAHA.107.187998. - DOI - PubMed
-
- Norgren L., Hiatt W.R., Dormandy J.A., Nehler M.R., Harris K.A., Fowkes F.G.R., Bell K., Caporusso J., Durand-Zaleski I., Komori K., et al. In inter-society consensus for the management of peripheral arterial disease (TASC II) Eur. J. Vasc. Endovasc. Surg. 2007;33:S1–S75. doi: 10.1016/j.ejvs.2006.09.024. - DOI - PubMed
-
- Fowkes F.G.R., Rudan D., Rudan I., Aboyans V., Denenberg J.O., McDermott M.M., Norman P.E., Sampson U.K.A., Williams L.J., Mensah G.A., et al. Comparison of global estimates of prevalence and risk factors for peripheral artery disease in 2000 and 2010: A systematic review and analysis. Lancet. 2013;382:1329–1340. doi: 10.1016/S0140-6736(13)61249-0. - DOI - PubMed
-
- Napoli A., Anzidei M., Zaccagna F., Cavallo Marincola B., Zini C., Brachetti G., Cartocci G., Fanelli F., Catalano C., Passariello R. Peripheral arterial occlusive disease: Diagnostic performance and Effect on therapeutic management of 64-Section CT Angiography. Radiology. 2011;261:976–986. doi: 10.1148/radiol.11103564. - DOI - PubMed
-
- Rastan A., Krankenberg H., Baumgartner I., Blessing E., Müller-Hülsbeck S., Pilger E., Scheinert D., Lammer J., Gißler M., Noory E., et al. Stent Placement versus balloon angioplasty for the treatment of obstructive lesions of the popliteal artery: A prospective, multicenter, randomized trial. Circulation. 2013;127:2535–2541. doi: 10.1161/CIRCULATIONAHA.113.001849. - DOI - PubMed
MeSH terms
LinkOut - more resources
Full Text Sources
Other Literature Sources
Medical
