

doi: 10.3390/ijms160511713.
Intravital FRET: Probing Cellular and Tissue Function in Vivo
Affiliations
- PMID: 26006244
- PMCID: PMC4463726
- DOI: 10.3390/ijms160511713
Item in Clipboard
Intravital FRET: Probing Cellular and Tissue Function in Vivo
Int J Mol Sci.
.
Abstract
The development of intravital Förster Resonance Energy Transfer (FRET) is required to probe cellular and tissue function in the natural context: the living organism. Only in this way can biomedicine truly comprehend pathogenesis and develop effective therapeutic strategies. Here we demonstrate and discuss the advantages and pitfalls of two strategies to quantify FRET in vivo-ratiometrically and time-resolved by fluorescence lifetime imaging-and show their concrete application in the context of neuroinflammation in adult mice.
Keywords: fluorescence lifetime imaging; genetically encoded calcium indicators; intravital FRET; multi-photon microscopy.
Figures
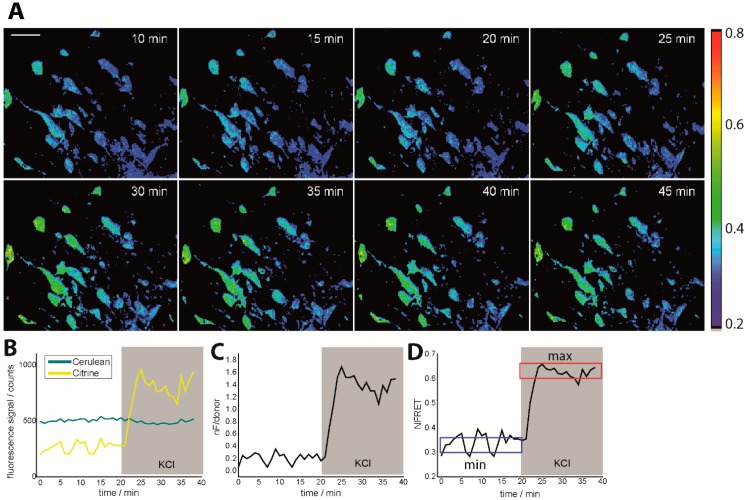
Intravital ratiometric FRET in healthy CerTN L15 mice. (A) Time-lapse of NFRET ratio of a 300 × 300 × 70 µm3 region in the brain stem of a CerTN L15 mouse before and during KCl treatment; (B) Cerulean and Citrine (donor and acceptor in TN L15) corrected averaged fluorescence signals during KCl treatment as well as averaged nF/donor ratio (C) and averaged NFRET ratio (D) time-evolutions. In (D), the blue frame defines the minimum NFRET ratio in healthy neurons, while the red frame defines the maximum NFRET ratio as given by treatment with KCl. The maximum NFRET ratio was validated by treatment with glutamate but is not the maximum reachable NFRET ratio as predicted by neurophysiology. The tolerance range for both minimum and maximum NFRET values is ≈0.1. CerTN L15 mice are genetically encoding the FRET-based Ca2+-biosensor TN L15 in neurons. λexc = 850 nm, λem (Cerulean) = 475 ± 20 nm, λem (Citrine) = 535 ± 25 nm. Scale bar = 50 µm. All images are represented as xyz projections.
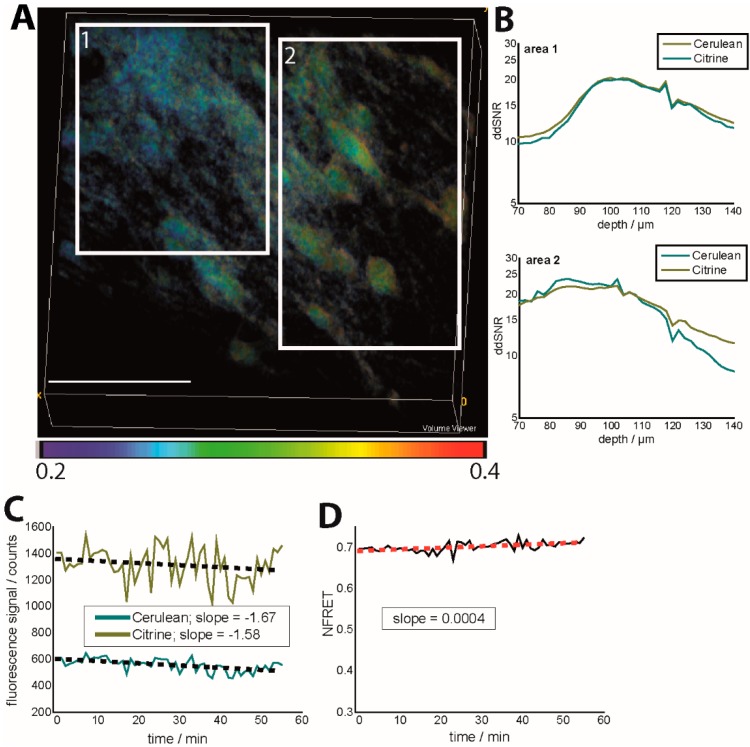
Effects of depth-dependent SNR and photobleaching on the NFRET ratio in the brain stem of CerTN L15 mice (intravital imaging in healthy and untreated tissue). (A) NFRET ratio 3D image (300 × 300 × 70 µm³). Regions of different depth-dependent signal-to-noise ratios (ddSNR) show different NFRET ratios although the expected neuronal calcium is expected to be the same; (B) Dependence of ddSNR on imaging depth for both Cerulean and Citrine fluorescence signals in the two areas labeled in (A); (C) Time-dependence of the fluorescence signals of Cerulean and Citrine in Movies S2 and S3 and linear approximation of the photobleaching-ind uced time-decay; (D) Time-dependence of the corresponding NFRET ratio (Movie S4) as a consequence of photobleaching. λexc = 850 nm, λem (Cerulean) = 475 ± 20 nm, λem (Citrine) = 535 ± 25 nm. The mean laser power was 8 mW at 850 nm and a 160-fs pulse width, as well as an 80-MHz laser repetition rate.
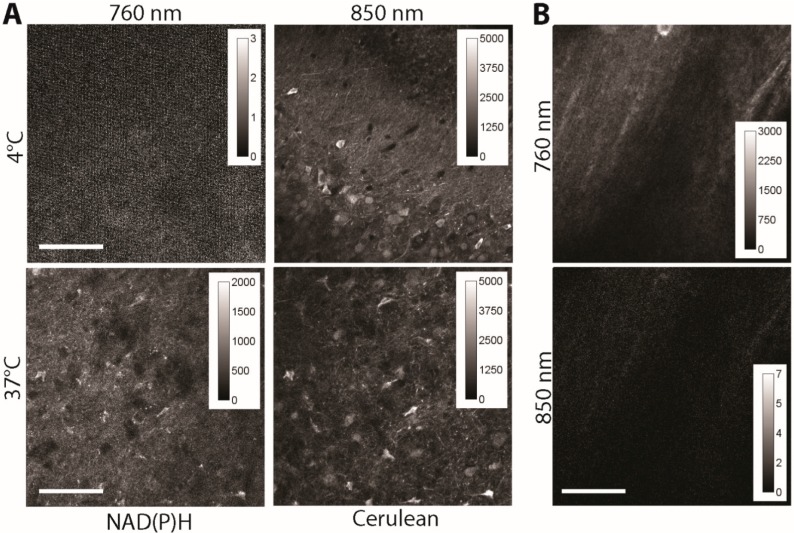
(A) Fluorescence signal of 300 × 300 µm areas in acute (live) brain slices of CerTN L15 mice as measured at 760 and 850 nm, respectively. Detection at λem = 460 ± 30 nm. The temperature was set at 4 and 37 °C, to decrease the NAD(P)H metabolism at a minimum (4 °C) and to increase it at physiological levels (37 °C), respectively. Since at 4 °C only free NAD(P)H of a much shorter fluorescence lifetime is detected, the fluorescence intensity under excitation at 760 nm is very low (NAD(P)H fluorescence representing the integral under the decay curve), whereas under excitation at 850 nm it appears at high levels (Cerulean). At 37 °C NAD(P)H is mostly involved in metabolic processes, i.e., is bound to enzymes, and shows an up to 10 times longer fluorescence lifetime as free NAD(P)H. Under these conditions, both under excitation at 760 nm and at 850 nm, high fluorescence signals are detected. The laser peak photon flux at the sample was kept constant for all experiments to ensure an accurate comparison; (B) Fluorescence signal of 300 × 300 µm2 areas in acute (live) brain slices of C57/B6 mice (wild-type) as measured at 760 and 850 nm, respectively. Detection at λem = 460 ± 30 nm. Scale bar = 100 µm.
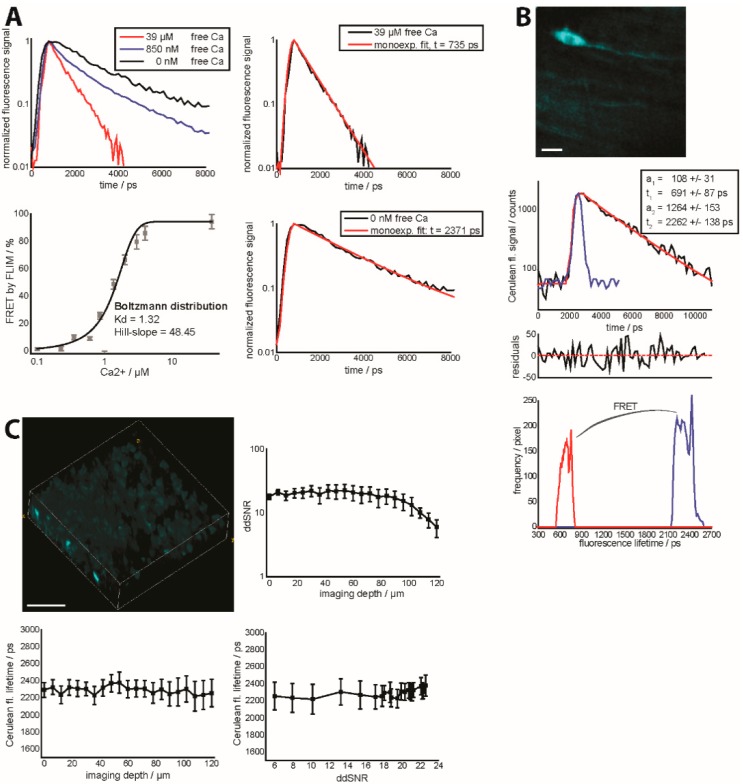
(A) Fluorescence decay curves (right, top) of the isolated construct TN L15 at 0 nM, 850 nM and 39 µM free calcium. The extreme conditions, i.e., 0 nM and 39 µM free calcium are additionally mono-exponentially approximated (left, top and bottom). Calibration curve of the biexponential FLIM-FRET ratio of the isolated construct TN L15 at various free calcium concentrations (right, bottom). a1 and a2 are the relative concentrations of FRET-quenched and unquenched Cerulean as given by the biexponential model of the fluorescence decay curve (Supplementary Material); (B) Fluorescence signal of Cerulean of a 150 × 150 × 20 µm3 (256 × 256 × 11 voxel) in the brain stem of a healthy CerTN L15 mouse (intravital measurement). The graph in the middle depicts an example of a decay curve in one of the brightest pixels of the image, including the biexponential approximation curve reconvolved with the instrument response function (blue curve), together with the final parameters and the corresponding residuals. The lowest graph shows the distributions of the fluorescence lifetimes of unquenched and FRET-quenched Cerulean over the 3D image at the top. Scale bar = 25 µm; (C) 3D fluorescence intensity image of Cerulean (right, top) in a healthy (live) brain slice of a CerTN L15 mouse (300 × 300 × 120 µm3, 517 × 517 × 40 voxel). ddSNR curve (left, top) as well as corresponding dependence of Cerulean fluorescence lifetime on imaging depth (right, bottom) and ddSNR (left, bottom). Detection at λem = 460 ± 30 nm. Excitation at λexc = 850 nm, mean laser power 8 mW.
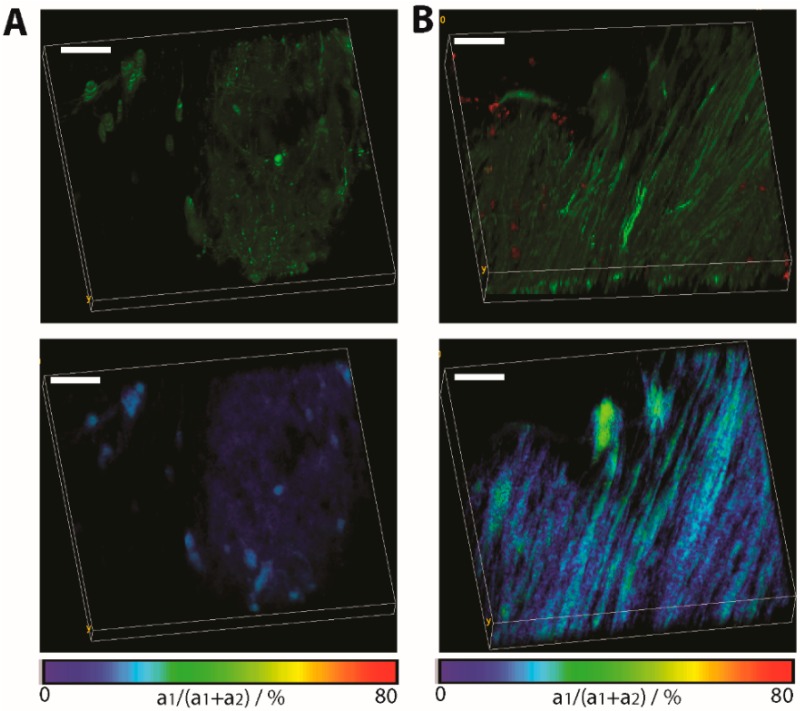
Application of FRET-FLIM in chronic neuro-inflammation to probe neuronal dysfunction. (A) Fluorescence intensity image (top) and FLIM-FRET ratio image (bottom) in a normal appearing region in the brain stem of a CerTN L15 x LysM tdRFP mouse. In the top image, certain subsets of neurons appear green; (B) The same images (intensity and FLIM-FRET ratio image) in a region of the brain stem invaded by immune cells (red). Image dimensions: 300 × 300 × 40 µm3 (517 × 517 × 21 voxel). λexc = 850 nm. λem = 460 ± 30 nm. Scale bar = 50 µm. As expected, at regions not affected by inflammation, the FRET ratio indicates physiological levels of neuronal calcium, while at the lesion site, the neuronal calcium increases at sustained pathological values.
References
-
- Roszik J., Toth G., Szollosi J., Vereb G. Validating pharmacological disruption of protein-protein interactions by acceptor photobleaching FRET imaging. Methods Mol. Biol. 2013;986:165–178. - PubMed
-
- Kumar S., Alibhai D., Margineanu A., Laine R., Kennedy G., McGinty J., Warren S., Kelly D., Alexandrov Y., Munro I., et al. FLIM FRET technology for drug discovery: Automated multiwell-plate high-content analysis, multiplexed readouts and application in situ. Chemphyschem. 2011;12:609–626. doi: 10.1002/cphc.201000874. - DOI - PMC - PubMed
Publication types
MeSH terms
Substances
LinkOut - more resources
Full Text Sources
Other Literature Sources
