. 2015 Jul 7;7(25):11005-12.
doi: 10.1039/c5nr02142a. Epub 2015 May 26.

A gold nanohole array based surface-enhanced Raman scattering biosensor for detection of silver(I) and mercury(II) in human saliva

Affiliations

A gold nanohole array based surface-enhanced Raman scattering biosensor for detection of silver(I) and mercury(II) in human saliva

Peng Zheng et al. Nanoscale. .

Abstract

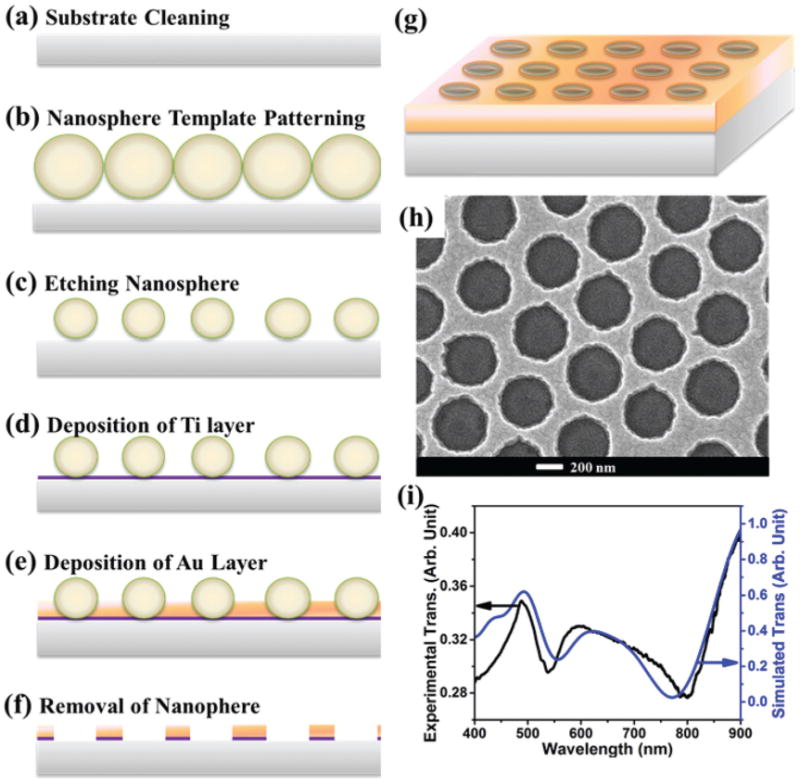
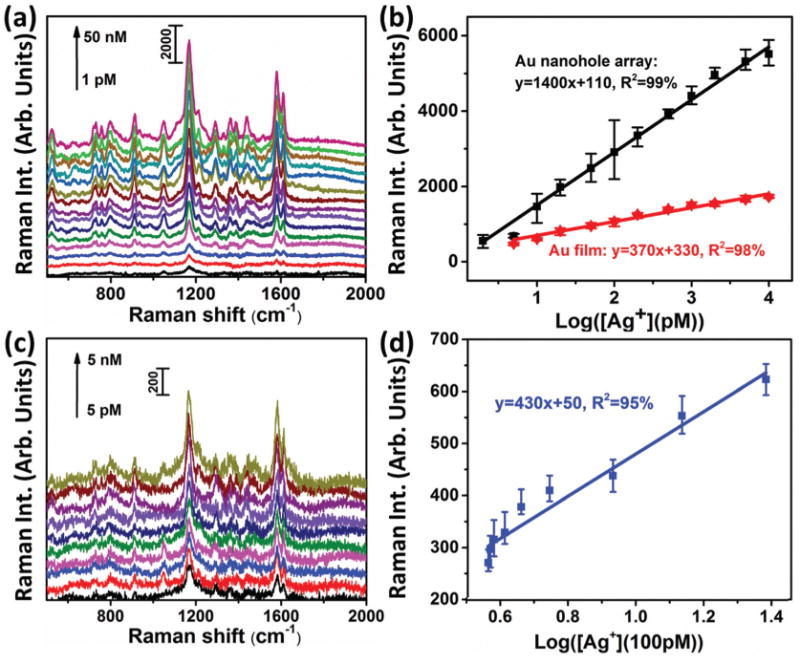
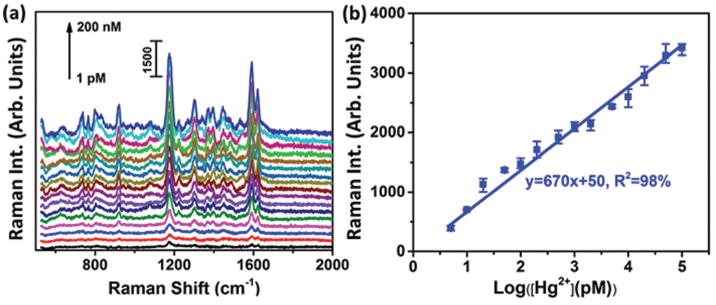
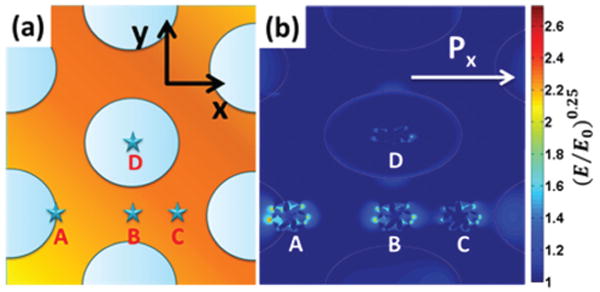
A surface-enhanced Raman scattering (SERS) biosensor has been developed by incorporating a gold nanohole array with a SERS probe (a gold nanostar@Raman-reporter@silica sandwich structure) into a single detection platform via DNA hybridization, which circumvents the nanoparticle aggregation and the inefficient Raman scattering issues. Strong plasmonic coupling between the Au nanostar and the Au nanohole array results in a large enhancement of the electromagnetic field, leading to amplification of the SERS signal. The SERS sensor has been used to detect Ag(I) and Hg(II) ions in human saliva because both the metal ions could be released from dental amalgam fillings. The developed SERS sensor can be adapted as a general detection platform for non-invasive measurements of a wide range of analytes such as metal ions, small molecules, DNA and proteins in body fluids.


Figures

Fig. 1
Fig. 1
Au nanostar@MGITC@SiO2 sandwich nanoparticles. (a) SEM image of Au nanostars; (b) UV-Vis absorption spectra of the bare Au nanostar and the Au nanostar@MGITC@SiO2; (c) and (d) TEM images of the Au nanostar@MGITC@SiO2.
Fig. 2
Fig. 2
A gold nanohole array pattern. (a–g) Protocol for Au nanohole array fabrication; (h) SEM image of a gold nanohole array with a hole diameter of 420 nm at a pitch of 600 nm, and a film thickness of 50 nm; (i) experimentally measured (black curve) and FDTD simulated (blue curve) transmission of the Au nanohole array.
Fig. 3
Fig. 3
The operating principle of the SERS sensor. The Au nanostar@MGITC@SiO2 sandwich nanoparticles and Au nanohole arrays were functionalized with ssDNA sequences. The two ssDNA sequences hybridize only when Hg2+ or Ag+ was present due to T–T or C–C mismatch.
Fig. 4
Fig. 4
Detection of Ag(i) ions with the SERS sensor. (a) SERS spectra acquired from the Au nanostar@MGITC@SiO2 particles captured by the Au nanohole array pattern for different levels of Ag(i) ions in a 10 mM MOPS buffer solution containing 30 mM NaNO3; (b) fitting curves and equations of the SERS peak intensity at 1174 cm−1 vs. the logarithmic concentration of Ag(i) ions. The black curve is for the detection conducted on a Au nanohole array; the red curve is for the detection on a Au film. (c) SERS spectra obtained from the Au nanostar@MGITC@SiO2 nanoparticles captured by the Au nanohole array pattern for different levels of Ag(i) ions in a mixture of MOPS buffer (2/3 vol.) and human saliva (1/3 vol.); (d) the fitting curve and equation of the SERS peak intensity at 1174 cm−1 vs. the logarithmic concentration of Ag(i) ions.
Fig. 5
Fig. 5
SERS sensor for Hg2+ detection. (a) SERS spectra of Au nanostar@MGITC@SiO2 on the Au nanohole array in the SERS sensor for the detection of Hg2+ in a mixed solution containing one portion of human saliva (1/3 vol.) and two portions of PBS buffer solution (2/3 vol.); (b) plots of the SERS peak intensity at 1174 cm−1 as a function of the logarithmic concentration of Hg2+.
Fig. 6
Fig. 6
Simulated EM field distributions. (a) FDTD simulation cells with four Au nanostars located at point A (the rim of a nanohole), point B (the gap center between two nanoholes), point C (the gap center between three nanoholes), and point D (the nanohole center); (b) simulated EM field distribution of Au nanostars on Au nanohole arrays at points A, B, C, and D. The simulations were conducted under x polarization with a 785 nm laser source. (E/E0)0.25 was used to represent the EM field enhancement for easy visualization.

References

    1. Aragay G, Pons J, Merkoci A. Chem Rev. 2011;111:3433–3458. - PubMed
    1. Duong TQ, Kim JS. Chem Rev. 2010;110:6280–6301. - PubMed
    1. Li M, Gou HL, Al-Ogaidi I, Wu NQ. ACS Sustainable Chem Eng. 2013;1:713–723.
    1. Hoang CV, Oyama M, Saito O, Aono M, Nagao T. Sci Rep. 2013;3:1175. - PMC - PubMed
    1. Long F, Zhu A, Shi HC, Wang HC, Liu JQ. Sci Rep. 2013;3:2308. - PMC - PubMed

Publication types