

Membrane tension controls the assembly of curvature-generating proteins
- PMID: 26008710
- PMCID: PMC4455092
- DOI: 10.1038/ncomms8219
Membrane tension controls the assembly of curvature-generating proteins
Abstract
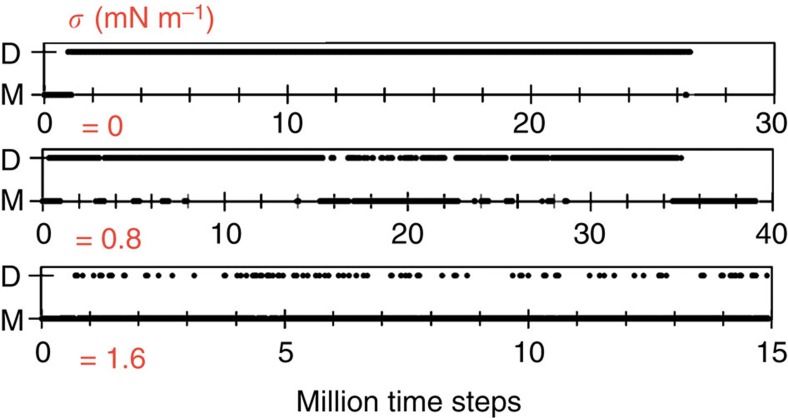
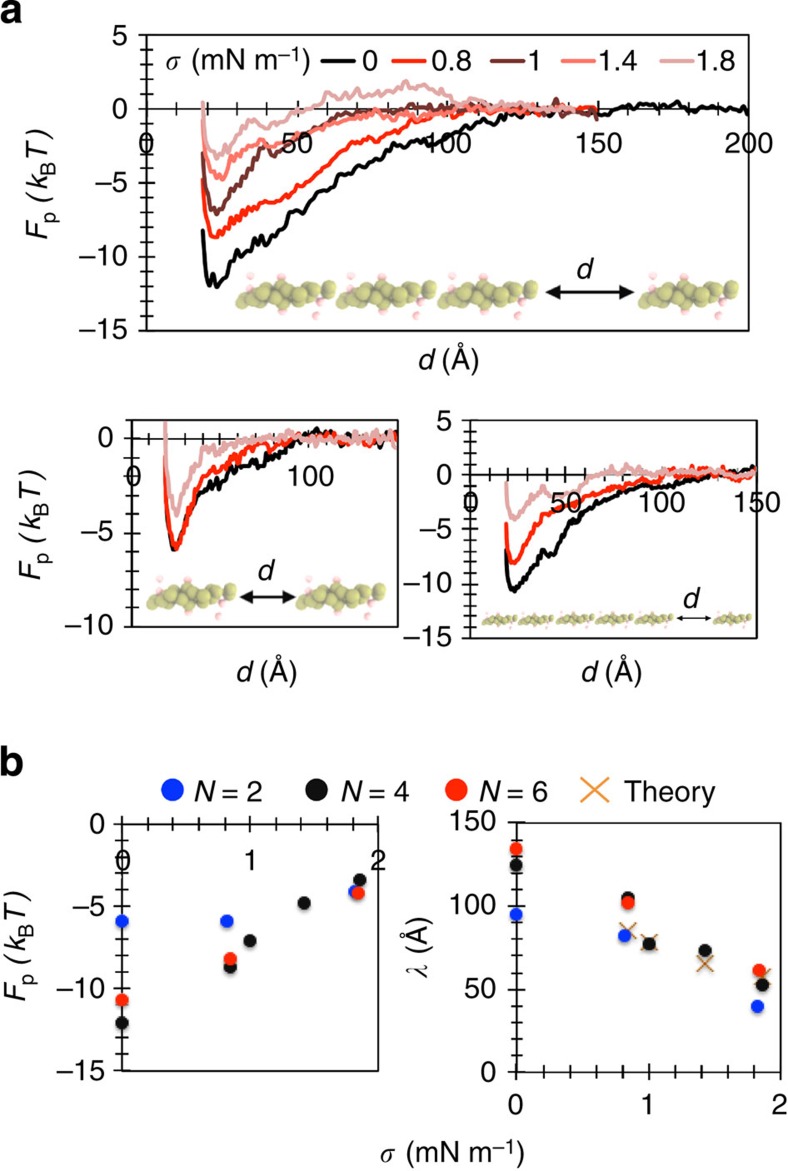
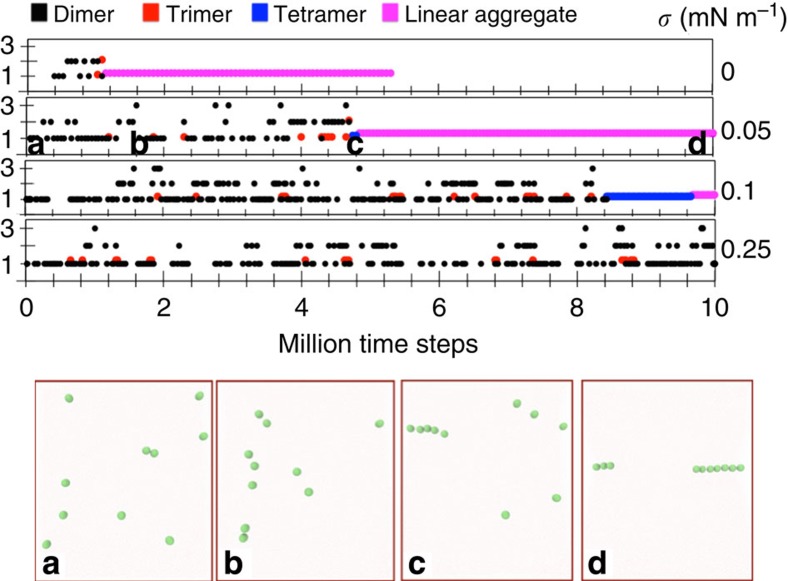
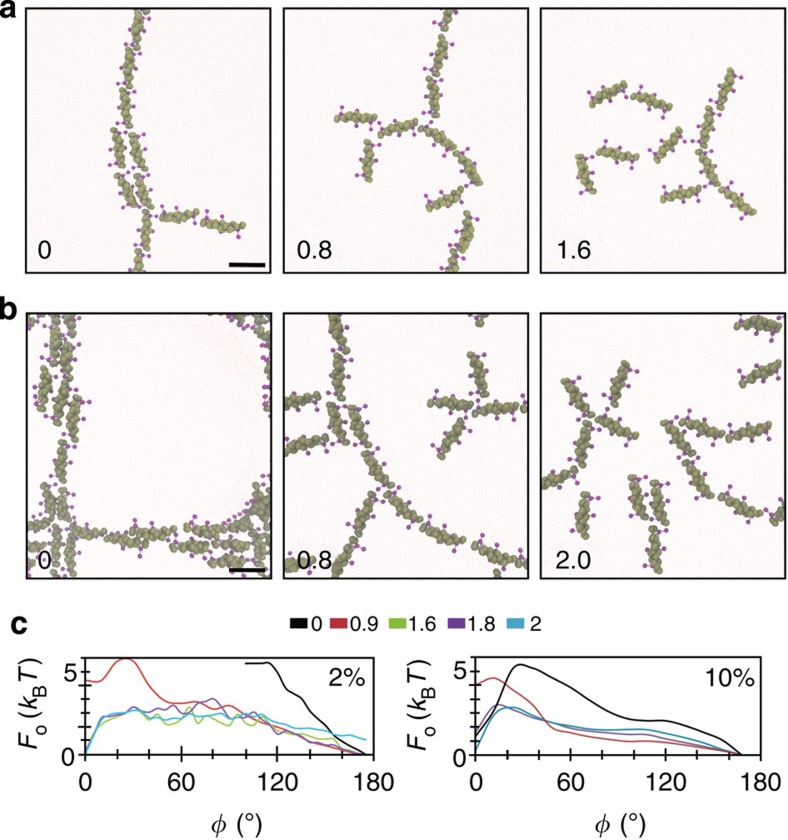
Proteins containing a Bin/Amphiphysin/Rvs (BAR) domain regulate membrane curvature in the cell. Recent simulations have revealed that BAR proteins assemble into linear aggregates, strongly affecting membrane curvature and its in-plane stress profile. Here, we explore the opposite question: do mechanical properties of the membrane impact protein association? By using coarse-grained molecular dynamics simulations, we show that increased surface tension significantly impacts the dynamics of protein assembly. While tensionless membranes promote a rapid formation of long-living linear aggregates of N-BAR proteins, increase in tension alters the geometry of protein association. At high tension, protein interactions are strongly inhibited. Increasing surface density of proteins leads to a wider range of protein association geometries, promoting the formation of meshes, which can be broken apart with membrane tension. Our work indicates that surface tension may play a key role in recruiting proteins to membrane-remodelling sites in the cell.
Figures
 , where κ=15 kBT.
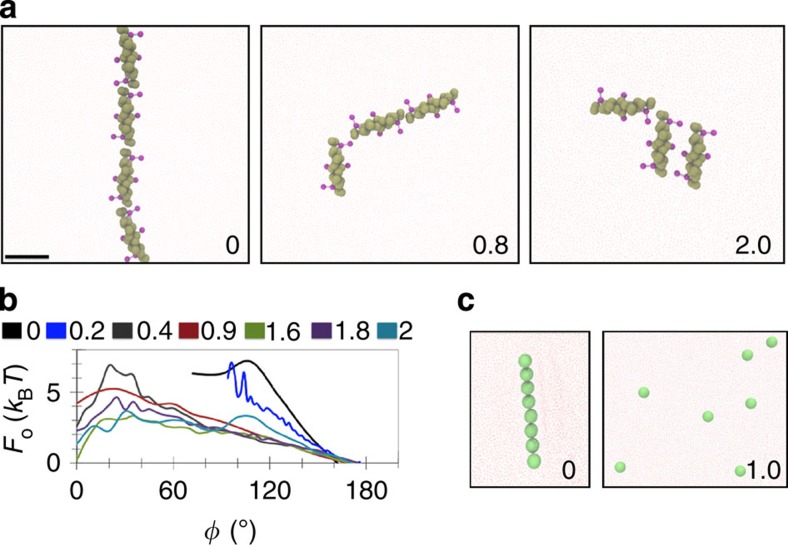

Similar articles
-
When Physics Takes Over: BAR Proteins and Membrane Curvature.Trends Cell Biol. 2015 Dec;25(12):780-792. doi: 10.1016/j.tcb.2015.09.005. Epub 2015 Oct 28. Trends Cell Biol. 2015. PMID: 26519988 Free PMC article. Review.
-
Direct observation of Bin/amphiphysin/Rvs (BAR) domain-induced membrane curvature by means of molecular dynamics simulations.Proc Natl Acad Sci U S A. 2006 Oct 10;103(41):15068-72. doi: 10.1073/pnas.0603917103. Epub 2006 Sep 28. Proc Natl Acad Sci U S A. 2006. PMID: 17008407 Free PMC article.
-
Curvature induction and sensing of the F-BAR protein Pacsin1 on lipid membranes via molecular dynamics simulations.Sci Rep. 2019 Oct 10;9(1):14557. doi: 10.1038/s41598-019-51202-z. Sci Rep. 2019. PMID: 31601944 Free PMC article.
-
How curvature-generating proteins build scaffolds on membrane nanotubes.Proc Natl Acad Sci U S A. 2016 Oct 4;113(40):11226-11231. doi: 10.1073/pnas.1606943113. Epub 2016 Sep 21. Proc Natl Acad Sci U S A. 2016. PMID: 27655892 Free PMC article.
-
F-BAR family proteins, emerging regulators for cell membrane dynamic changes-from structure to human diseases.J Hematol Oncol. 2015 May 9;8:47. doi: 10.1186/s13045-015-0144-2. J Hematol Oncol. 2015. PMID: 25956236 Free PMC article. Review.
Cited by
-
Utilizing Machine Learning to Greatly Expand the Range and Accuracy of Bottom-Up Coarse-Grained Models through Virtual Particles.J Chem Theory Comput. 2023 Jul 25;19(14):4402-4413. doi: 10.1021/acs.jctc.2c01183. Epub 2023 Feb 20. J Chem Theory Comput. 2023. PMID: 36802592 Free PMC article.
-
Membrane tubule formation by banana-shaped proteins with or without transient network structure.Sci Rep. 2016 Feb 11;6:20935. doi: 10.1038/srep20935. Sci Rep. 2016. PMID: 26863901 Free PMC article.
-
Maintenance and loss of endocytic organelle integrity: mechanisms and implications for antigen cross-presentation.Open Biol. 2021 Nov;11(11):210194. doi: 10.1098/rsob.210194. Epub 2021 Nov 10. Open Biol. 2021. PMID: 34753318 Free PMC article. Review.
-
Nonadditivity in Many-Body Interactions between Membrane-Deforming Spheres Increases Disorder.ACS Nano. 2024 Aug 27;18(34):23067-23076. doi: 10.1021/acsnano.4c05222. Epub 2024 Aug 15. ACS Nano. 2024. PMID: 39145618 Free PMC article.
-
When Physics Takes Over: BAR Proteins and Membrane Curvature.Trends Cell Biol. 2015 Dec;25(12):780-792. doi: 10.1016/j.tcb.2015.09.005. Epub 2015 Oct 28. Trends Cell Biol. 2015. PMID: 26519988 Free PMC article. Review.
References
-
- Lipowsky R. The conformation of membranes. Nature 349, 475–481 (1991). - PubMed
-
- Goetz R., Gompper G. & Lipowsky R. Mobility and elasticity of self-assembled membranes. Phys. Rev. Lett. 82, 221–224 (1999).
-
- McMahon H. T. & Gallop J. L. Membrane curvature and mechanisms of dynamic cell membrane remodelling. Nature 438, 590–596 (2005). - PubMed
Publication types
MeSH terms
Substances
Grants and funding
LinkOut - more resources
Full Text Sources
Other Literature Sources
