. 2015 May 25;209(4):563-77.
doi: 10.1083/jcb.201410026.

BLOC-2 targets recycling endosomal tubules to melanosomes for cargo delivery

Affiliations

BLOC-2 targets recycling endosomal tubules to melanosomes for cargo delivery

Megan K Dennis et al. J Cell Biol. .

Abstract

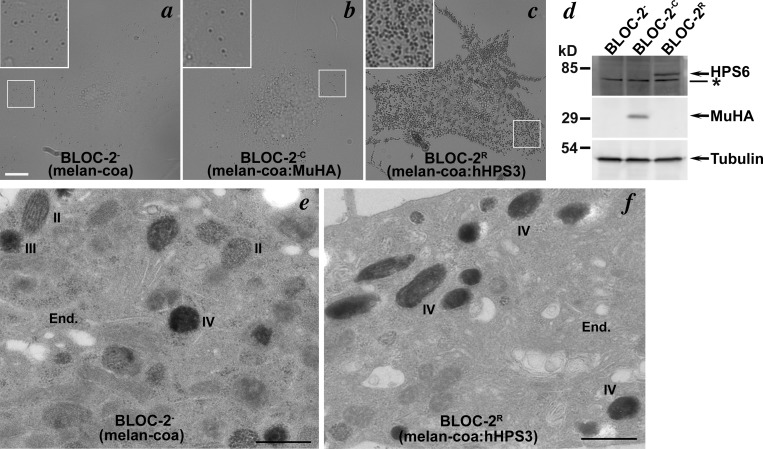
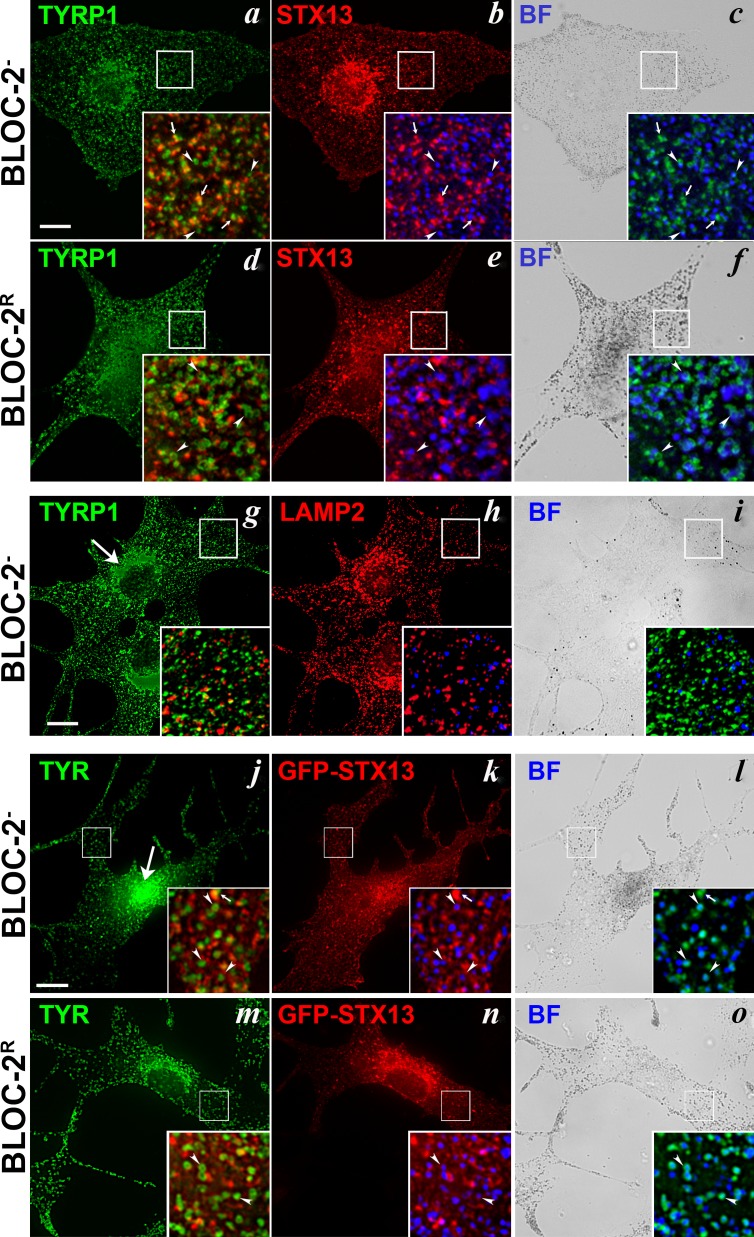
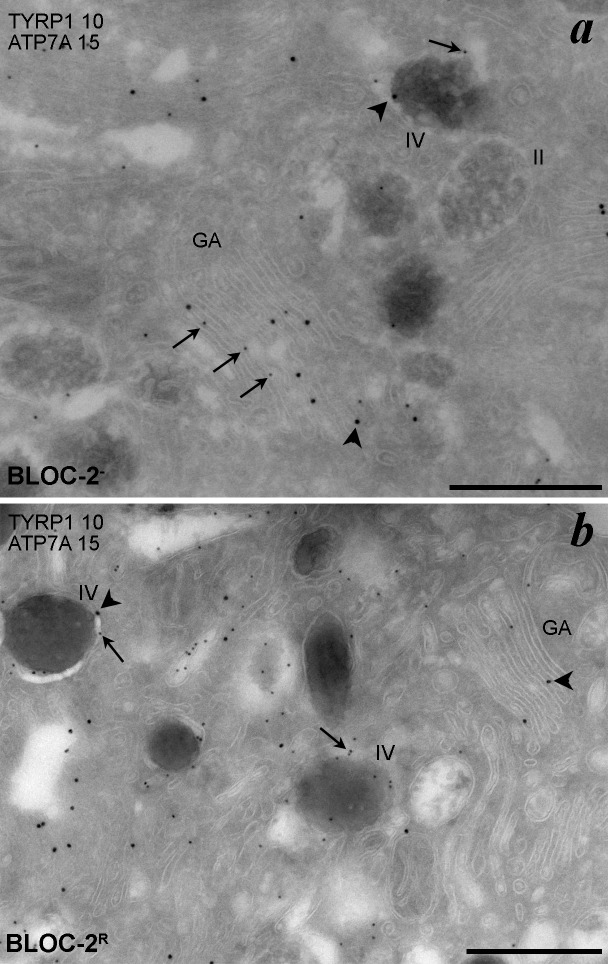
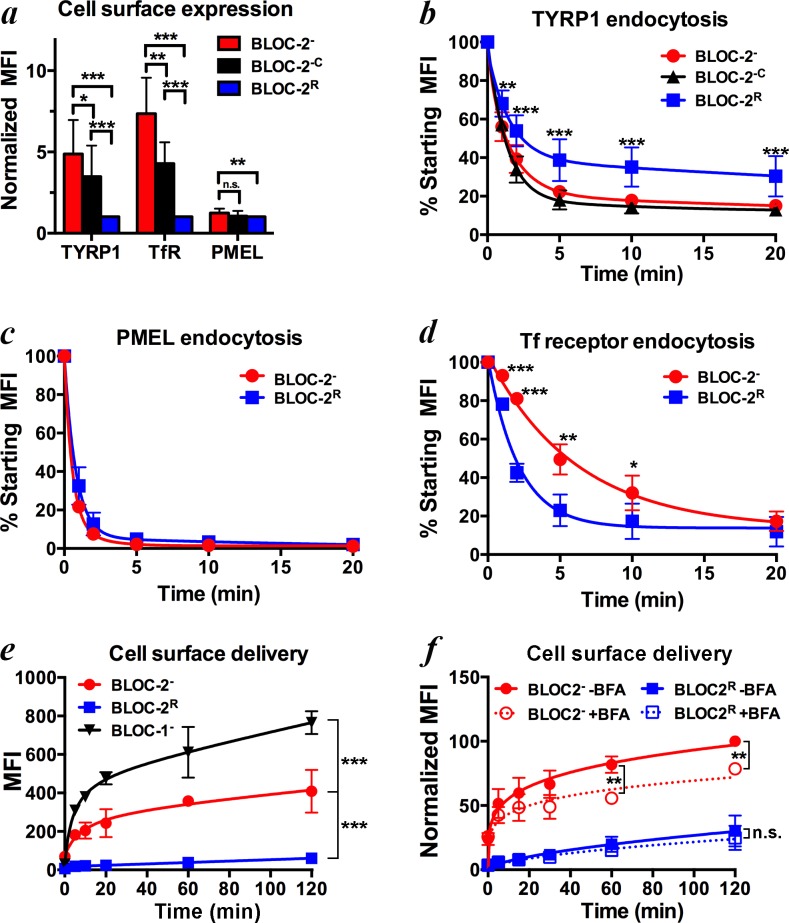
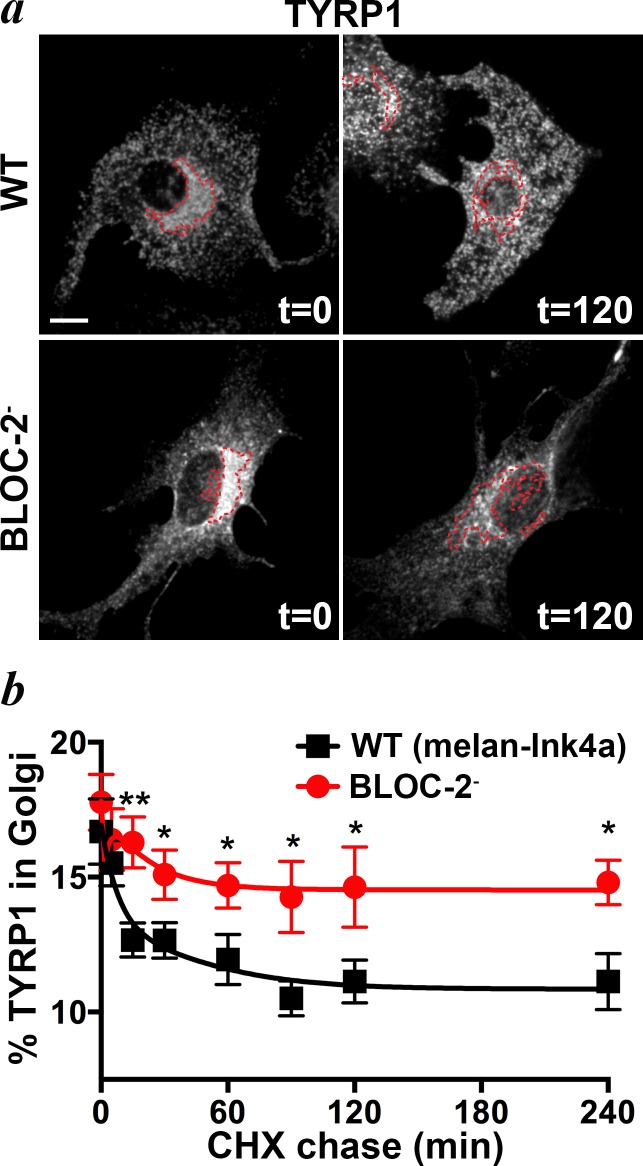
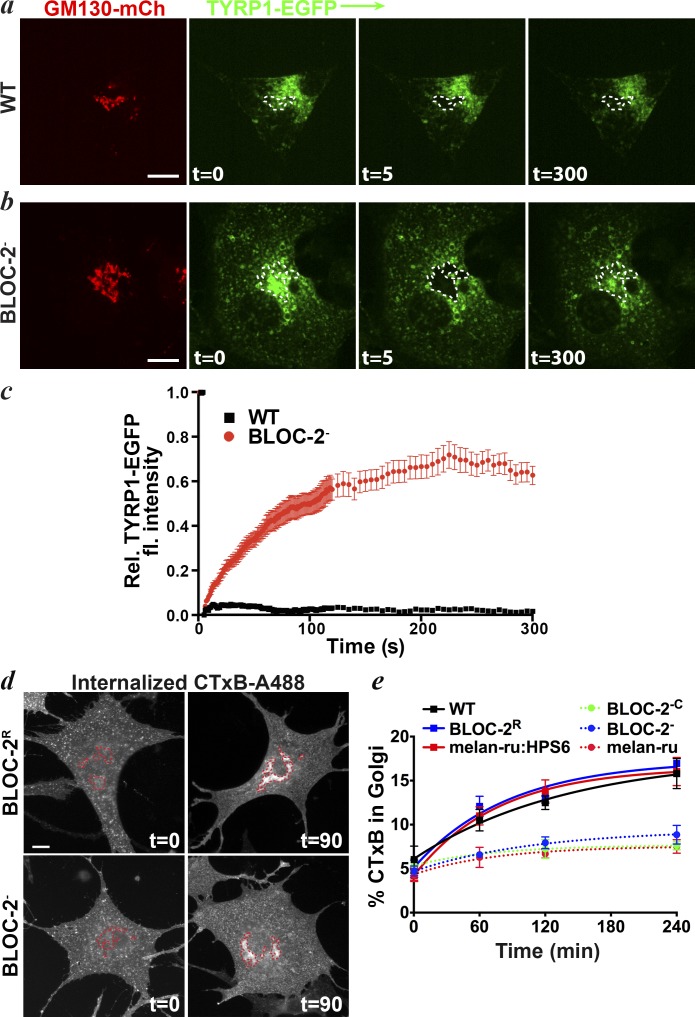
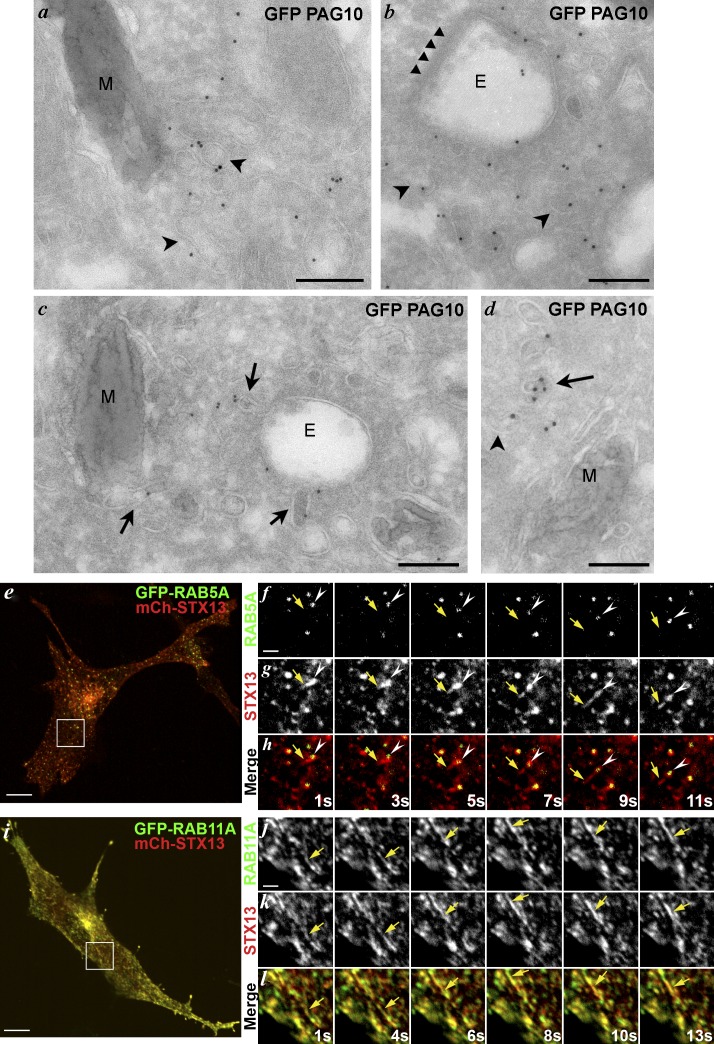
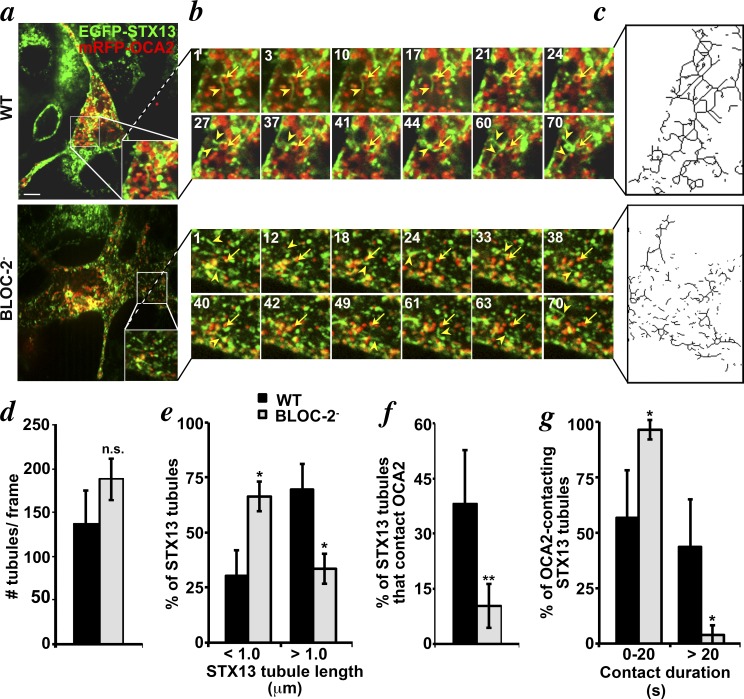
Hermansky-Pudlak syndrome (HPS) is a group of disorders characterized by the malformation of lysosome-related organelles, such as pigment cell melanosomes. Three of nine characterized HPS subtypes result from mutations in subunits of BLOC-2, a protein complex with no known molecular function. In this paper, we exploit melanocytes from mouse HPS models to place BLOC-2 within a cargo transport pathway from recycling endosomal domains to maturing melanosomes. In BLOC-2-deficient melanocytes, the melanosomal protein TYRP1 was largely depleted from pigment granules and underwent accelerated recycling from endosomes to the plasma membrane and to the Golgi. By live-cell imaging, recycling endosomal tubules of wild-type melanocytes made frequent and prolonged contacts with maturing melanosomes; in contrast, tubules from BLOC-2-deficient cells were shorter in length and made fewer, more transient contacts with melanosomes. These results support a model in which BLOC-2 functions to direct recycling endosomal tubular transport intermediates to maturing melanosomes and thereby promote cargo delivery and optimal pigmentation.


Figures

Figure 1.
Figure 1.
BLOC-2 melanocytes are hypopigmented and pigmentation is restored by expression of the deficient BLOC-2 subunit. (ac) Bright-field microscopy analysis of untransfected HPS3-deficient melan-coa (BLOC-2, a) or stable transfectants expressing Muted-HA (melan-coa:MuHA or BLOC-2−C, b) or hHPS3 (melan-coa:hHPS3 or BLOC-2R, c). Images were taken at identical lighting and camera settings. Insets, 2.5× magnification of boxed regions. Bar, 10 µm. (d) BLOC-2, BLOC-2−C, and BLOC-2R whole cell lysates were fractionated by SDS-PAGE and immunoblotted with antibodies to HPS6, HA epitope, or γ-tubulin as a loading control. (left) Migration of molecular mass markers (in kilodaltons); arrows indicate relevant bands; the asterisk shows a nonspecific band recognized by anti-HPS6 antiserum. (e and f) Standard electron microscopy analysis of BLOC-2 and BLOC-2R melanocytes. End., endosomes; II, III, and IV, different stages of melanosomes. Bars, 500 nm.
Figure 2.
Figure 2.
TYRP1 but not TYR is partially mislocalized to early endosomes in the periphery of BLOC-2 cells. (ao) BLOC-2 (ac and g–l) and BLOC-2R (df and mo) melanocytes were analyzed by deconvolution IFM after double labeling for TYRP1 (ai) and STX13 (a–f) or LAMP2 (g–i), or transfection with EGFP-STX13 and labeling for TYR (jo). Bright-field (BF) images are shown in c, f, i, l, and o. Insets, 3× (jo) or 3.5× (all others) magnifications of the boxed regions as merged images with bright-field images pseudocolored blue. Arrows in insets, examples of overlap between TYRP1 or TYR and STX13 in BLOC-2 cells; arrowheads, examples of overlap between TYRP1 or TYR and pigment granules; large arrows, perinuclear accumulation of TYRP1 or TYR in BLOC-2 cells. Bars, 10 µm.
Figure 3.
Figure 3.
TYRP1 accumulates in the Golgi of BLOC-2 melanocytes. (a and b) Immunoelectron microscopy of ultrathin cryosections from BLOC-2 (a) and BLOC-2R (b) melanocytes that were immunogold labeled for TYRP1 using10-nm protein A gold (TYRP1 10) and for ATP7A using 15-nm protein A gold (ATP7A 15). GA, Golgi apparatus; II and IV, stage II and IV melanosomes. Arrows show examples of TYRP1 labeling in the Golgi and stage IV melanosomes in BLOC-2 melanocytes (a) and on stage IV melanosomes in BLOC-2R cells (b); note labeling on tubular and vacuolar endosomes in both cell types. Arrowheads show examples of ATP7A labeling on the Golgi and melanosomes in both cell types. Bars, 500 nm.
Figure 4.
Figure 4.
Increased TYRP1 cycling through the plasma membrane in BLOC-2 melanocytes. (a) Comparison of cell surface levels of TYRP1, TfR, or PMEL among BLOC-2, BLOC-2−C, and BLOC-2R melanocytes by flow cytometry after labeling of whole cells on ice with unlabeled primary and AF488-conjugated secondary antibody. The mean fluorescence intensity (MFI) ± SD over 4–15 experiments, each performed in duplicate or quadruplicate, was normalized to 1.0 for BLOC-2R melanocytes within each experiment. (bd) Quantification of TYRP1 (b), PMEL (c), and TfR (d) endocytosis rates. BLOC-2, BLOC-2−C, or BLOC-2R cells were incubated with unlabeled antibodies on ice and loss of surface antibody (detected with fluorescent secondary antibody) over time at 37°C was quantified by flow cytometry. MFI at each time point was calculated and plotted relative to MFI at time 0 (defined as 100%). Values (means ± SD) were from two to eight separate experiments performed in duplicate. (b and d) P-values are indicated for comparison of BLOC-2R to BLOC-2 cells. Values in c were not significantly different. (e and f) Quantification of TYRP1 flux through the plasma membrane. Uptake of saturating levels of fluorescent anti-TYRP1 antibody by BLOC-2, BLOC-2R, or BLOC-1–deficient melan-mu cells (BLOC-1) at 37°C was quantified over time by flow cytometry. In f, cells were left untreated or were treated with 10 µg/ml brefeldin A (BFA) for 1 h before and during the experiment as indicated. Values (means ± SD) were from at least three independent experiments performed either in duplicate or quadruplicate and represent raw MFI (e) or a normalized value (f) calculated as the percentage of the MFI value for untreated BLOC-2 cells at 2 h. P-values shown in e correspond to all points in the graph except the initial time point; p-values in f are shown only for differences deemed significant between −BFA and +BFA samples. *, P < 0.05; **, P < 0.01; ***, P < 0.001; n.s., not significant.
Figure 5.
Figure 5.
TYRP1 that accumulates in the Golgi of BLOC-2 melanocytes is not newly synthesized. WT melan-Ink4a or BLOC-2 cells on coverslips were treated with CHX at 37°C for the indicated times, and then fixed, labeled for TYRP1 and the Golgi marker giantin, and analyzed by IFM. (a) Representative deconvolved images of TYRP1 labeling at the 0 and 120 min time points. Red outline, Golgi region defined by giantin labeling. Bar, 10 µm. (b) The intensity of TYRP1 in the giantin-positive Golgi region was quantified relative to total TYRP1 fluorescence and plotted over time. Data represent means ± SD from ≥50 cells in three independent experiments. *, P < 0.05; **, P < 0.01.
Figure 6.
Figure 6.
Retrograde trafficking of TYRP1 to the Golgi is specifically increased in BLOC-2 melanocytes. (ac) WT melan-Ink4a or BLOC-2 cells transiently expressing TYRP1-EGFP and GM130-mCh to mark the Golgi, were pretreated with CHX for 60 min at 37°C and then imaged by spinning disk microscopy (t = 0). GFP fluorescence within the Golgi region labeled by GM130-mCh was bleached at frame 5 (t = 5), and recovery of TYRP1-EGFP fluorescence intensity was quantified over time by normalizing to prebleach GFP intensity of the same region. (a and b) Representative images for GM130-mCh and TYRP1-EGFP from t = 0, t = 5, and t = 300 (300 s) for WT (a) and BLOC-2 cells (b). Bleached region is indicated by the dotted white line in TYRP1-EGFP images. Bars, 10 µm. (c) Quantification of fluorescence recovery. Rel., relative; fl., fluorescence. Values represent the means ± SD of GFP intensity traces of 15 cells of each type. (d and e) WT (melan-Ink4a), “rescued” BLOC-2R (melan-coa:hHPS3), or melan-ru:HPS6, or BLOC-2–deficient BLOC-2 (melan-coa), BLOC-2−C, or melan-ru cells on coverslips were incubated with AF488-conjugated CTxB on ice for 1 h and then at 20°C for 15 min to allow for internalization. Cells were washed once and incubated at 37°C for the indicated times, fixed, labeled with the anti-giantin antibody and analyzed by IFM. (d) Representative CTxB fluorescence images of BLOC-2 and BLOC-2R cells at the 0 and 90 min time points (t = 0, t = 90) showing appearance of CTxB in the Golgi (giantin staining; red outline) by 90 min. Bar, 10 µm. (e) Fluorescence intensity of AF488-CTxB in the giantin-positive region was quantified and plotted over time for all cell types. Values (means ± SD) for all BLOC-2–deficient lines are significantly different (P < 0.01 at 60 min and P < 0.001 at 120 and 240 min) from their paired BLOC-2–sufficient lines.
Figure 7.
Figure 7.
EGFP-STX13 labels recycling endosomal-derived transport intermediates in melanocytic cells. (ad) Ultrathin cryosections of fixed human MNT-1 melanoma cells that stably express EGFP-STX13 were labeled with anti-GFP antibody and protein A conjugated to 10-nm gold particles (PAG10) and then analyzed by electron microscopy. Arrowheads point to vesicular structures associated with melanosomes (M; a and d) or endosomes (E; b); arrows (c and d) point to tubules that are continuous with endosomes or melanosomes; triangles (b) point to a bilayered clathrin coat on a vacuolar endosome. Bars, 200 nm. (el). WT melan-Ink4a mouse melanocytes were transiently transfected with mCh-STX13 and either GFP-RAB5A (eh) or GFP-RAB11A (il) and analyzed 24 h later by spinning-disk confocal microscopy. (e and i) Single frames of representative cells showing overlap of mCh-STX13 with RAB5A-labeled vesicles (e) or RAB11A-labeled tubules (i). Bars, 10 µm. Image sequences from the boxed region in e and i are shown magnified 3× in fh and jl, respectively, with each label shown individually in black and white (f, g, j, and k) and merged images shown in color (h and l); elapsed time in seconds is indicated at bottom right. In fh, an mCh-STX13–labeled tubule (yellow arrows) emerges from a GFP-RAB5–labeled punctate structure (white arrowheads). In jl, a tubule (yellow arrows) is labeled for both mCh-STX13 and GFP-RAB11A. Bars, 2 µm.
Figure 8.
Figure 8.
BLOC-2 facilitates contacts of recycling endosomal tubules with maturing melanosomes. WT melan-Ink4a and BLOC-2 cells stably expressing EGFP-STX13 were transfected with mRFP-OCA2 and imaged in a single plane at 1 fps for 5 min by spinning disk microscopy. (a) Starting frame from representative image series (Videos 3 and 5). Boxed region is magnified 2× in inset. Bar, 10 µm. (b) Frames from the image series of the magnified boxed region in a at the times (seconds) indicated in top left. Arrows, melanosomes that interact with tubules; arrowheads, examples of tubules. (c) EGFP-STX13 labeling in a single panel highlighted in b was analyzed using the ImageJ “skeletonize” function to emphasize tubule length (Videos 4 and 6 for image series). (d) The number of EGFP-STX13 tubules (branched structures in skeletonized images) per video frame using a constant frame size (12 × 12 µm) was quantified within at least five WT and BLOC-2 cells in each of three independent experiments. Shown is the mean number of tubules (±SD) identified in each frame. (e) The length of EGFP-STX13 tubules between vertices in skeletonized images was quantified within 10 WT and BLOC-2 cells each in three independent experiments. Shown are the percentages (means ± SD) of tubules with lengths shorter or longer than 1 µm. (f) The percentage of EGFP-STX13 tubules that contact mRFP-OCA2–positive compartments was quantified using a MATLAB program and averaged from five WT and BLOC-2 cells each in six independent experiments. Shown are the mean values ± SD. (g) For those EGFP-STX13 tubules that contact mRFP-OCA2 compartments, the duration of contact was quantified. Shown are the percentages of contacts (means ± SD) that lasted for greater or less than 20 s. *, P < 0.05; **, P < 0.01.

References

    1. Bartölke R., Heinisch J.J., Wieczorek H., and Vitavska O.. 2014. Proton-associated sucrose transport of mammalian solute carrier family 45: an analysis in Saccharomyces cerevisiae. Biochem. J. 464:193–201. 10.1042/BJ20140572 - DOI - PubMed
    1. Bellono N.W., Escobar I.E., Lefkovith A.J., Marks M.S., and Oancea E.. 2014. An intracellular anion channel critical for pigmentation. eLife. 3:e04543 10.7554/eLife.04543 - DOI - PMC - PubMed
    1. Berson J.F., Frank D.W., Calvo P.A., Bieler B.M., and Marks M.S.. 2000. A common temperature-sensitive allelic form of human tyrosinase is retained in the endoplasmic reticulum at the nonpermissive temperature. J. Biol. Chem. 275:12281–12289. 10.1074/jbc.275.16.12281 - DOI - PubMed
    1. Boissy R.E., Richmond B., Huizing M., Helip-Wooley A., Zhao Y., Koshoffer A., and Gahl W.A.. 2005. Melanocyte-specific proteins are aberrantly trafficked in melanocytes of Hermansky-Pudlak syndrome-type 3. Am. J. Pathol. 166:231–240. 10.1016/S0002-9440(10)62247-X - DOI - PMC - PubMed
    1. Bonifacino J.S., and Rojas R.. 2006. Retrograde transport from endosomes to the trans-Golgi network. Nat. Rev. Mol. Cell Biol. 7:568–579. 10.1038/nrm1985 - DOI - PubMed

Publication types

Substances