. 2015 May 25;209(4):579-93.
doi: 10.1083/jcb.201412049.

Receptor dimerization dynamics as a regulatory valve for plasticity of type I interferon signaling

Affiliations

Receptor dimerization dynamics as a regulatory valve for plasticity of type I interferon signaling

Stephan Wilmes et al. J Cell Biol. .

Abstract

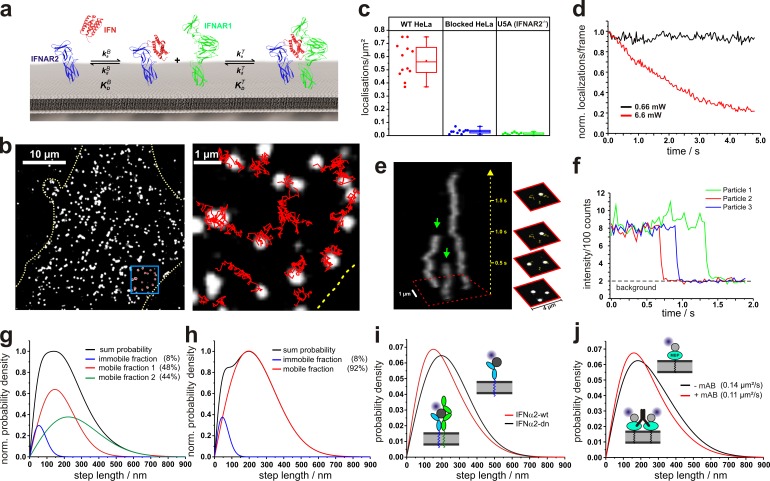
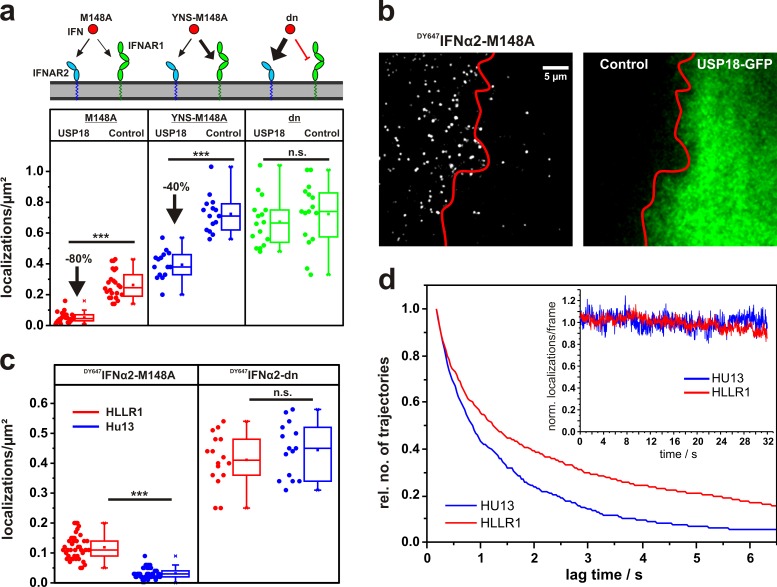
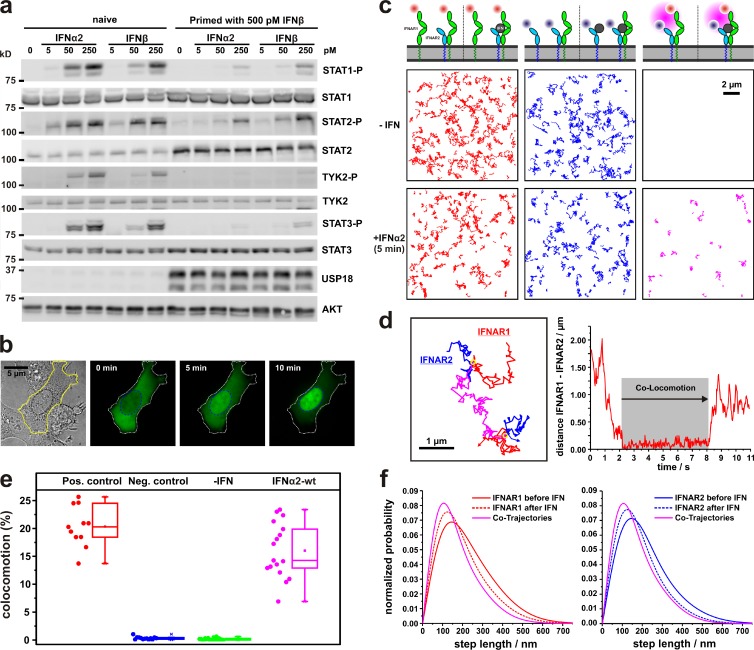
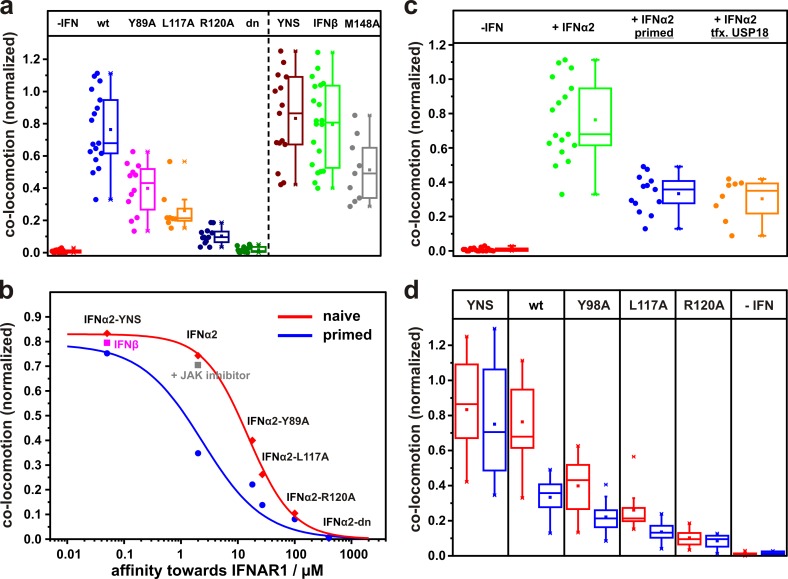
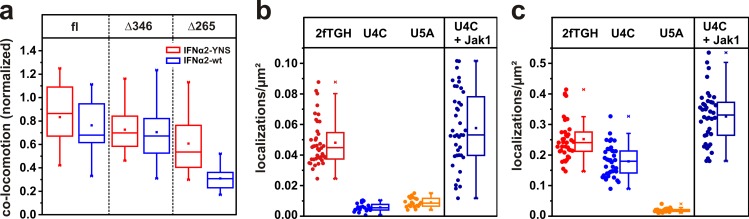
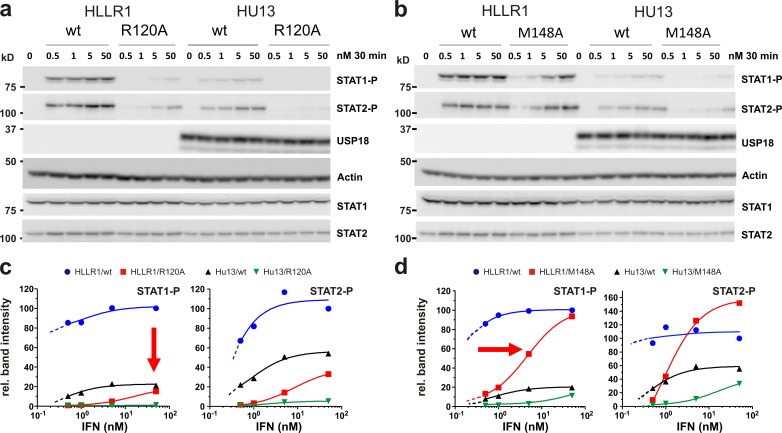
Type I interferons (IFNs) activate differential cellular responses through a shared cell surface receptor composed of the two subunits, IFNAR1 and IFNAR2. We propose here a mechanistic model for how IFN receptor plasticity is regulated on the level of receptor dimerization. Quantitative single-molecule imaging of receptor assembly in the plasma membrane of living cells clearly identified IFN-induced dimerization of IFNAR1 and IFNAR2. The negative feedback regulator ubiquitin-specific protease 18 (USP18) potently interferes with the recruitment of IFNAR1 into the ternary complex, probably by impeding complex stabilization related to the associated Janus kinases. Thus, the responsiveness to IFNα2 is potently down-regulated after the first wave of gene induction, while IFNβ, due to its ∼100-fold higher binding affinity, is still able to efficiently recruit IFNAR1. Consistent with functional data, this novel regulatory mechanism at the level of receptor assembly explains how signaling by IFNβ is maintained over longer times compared with IFNα2 as a temporally encoded cause of functional receptor plasticity.


Figures

Figure 1.
Figure 1.
Single-molecule localization and tracking of DY647IFN binding to endogenous cell surface IFNAR. (a) Ligand-induced assembly of a dynamic ternary complex. The effective ligand binding affinity to the cell surface receptor depends on the dynamic equilibrium between the binary and ternary complex. (b) Live-cell IFNα2 binding assay by single-molecule imaging on HeLa. (b, left) A fluorescence image showing individual DY647IFNα2-wt bound to the cell surface receptor. (b, right) Trajectories of IFNα2-wt molecules from the boxed region. The boundaries of the cell are indicated by a yellow dotted line. (c) Density of DY647IFNα2-wt molecules localized on the surface of individual HeLa cells imaged in the presence of 2 nM DY647IFNα2-wt. For comparison, the density of DY647IFNα2-wt molecules on HeLa cells blocked with unlabeled IFNα2-wt is shown in addition to IFNAR2-deficient U5A cells. Data distribution of the second and third quartile (box), median (line), mean (closed square), and whiskers (1.5× interquartile range) is shown. (d) Normalized bleaching of DY647IFNα2-wt (>150 particles at t = 0) bound to endogenous receptors on HeLa at standard conditions and 10-fold increased laser power. Representative curves are shown for at least five experiments. (e) Single-step bleaching of labeled IFNs depicted as a 3D kymograph. Bleaching events are indicated by green arrows. (f) Single-step bleaching events of three individually labeled IFNs (representative curves for >100 bleached particles). (g) Diffusion properties of cell-bound DY647IFNα2-wt presented as the step length distribution for a time lapse of 160 ms (5 frames, black curve), which was obtained by fitting the step length histogram by considering three components corresponding to an immobile as well as a slow and a fast mobile fraction (Fig. S1). (h) Diffusion properties of cell-bound DY647IFNα2-dn and fit according to a two-component model. (i) Comparison of the step-length histogram for DY647IFNα2-wt and DY647IFNα2-dn. The data shown in g–i are pooled from at least two independent experiments, each with >650 analyzed trajectories (≥15 steps) per IFN mutant. (j) Changes in mobility of a model transmembrane protein dimerized by a monoclonal antibody. The data shown are pooled from eight independent experiments with >400 analyzed trajectories for each experiment (≥15 steps).
Figure 2.
Figure 2.
The role of USP18 in receptor assembly probed by quantitative ligand-binding assays. (a) Density of DY647IFNα2-M148A, DY647IFNα2-YNS-M148A, and DY647IFNα2-dn (α8tail-R120E) on HeLa cells expressing USP18 and wt HeLa cells in comparison. (b) HeLa cells transiently transfected with EGFP-USP18 (green channel, right) after incubation of 2 nM DY647IFNα2-M148A. For comparison, a nontransfected cell is shown in the same image. (c) Localization density in the presence of 2 nM DY647IFNα2-M148A and DY647IFNα2-dn, respectively, on cells stably transfected with USP18 (HU13) and to parental cells (HLLR1). ***, P > 0.001. (d) Life-time of DY647IFNα2-M128A binding to HLLR1 and HU13 cells, respectively, as obtained by trajectory length analysis. Inset: bleaching control. The curves were obtained from >10 independent experiments with >600 analyzed trajectories (≥5 steps) for HU13 and >1,000 trajectories for HLLR1, respectively. Box plots indicate the data distribution of the second and third quartile (box), median (line), mean (closed squares), and whiskers (1.5× interquartile range).
Figure 3.
Figure 3.
Receptor dimerization probed by single-molecule colocomotion analysis. (a and b) Functional properties of U5A cells, which were stably complemented with tagged IFNAR1 and IFNAR2 (U5AIFNAR1/IFNAR2) for posttranslational labeling and single-molecule imaging. (a) Western blot analysis of STAT phosphorylation, USP18 expression, and differential desensitization to IFNα2 and IFNβ. (b) IFN-induced translocation of STAT1-EGFP into the nucleus. (c) IFN-induced receptor dimerization revealed by single-molecule colocomotion experiments. Trajectories (80 frames, ∼2.5 s) of individual TMR-labeled IFNAR1 (red), DY647-labeled IFNAR2 (blue), and co-trajectories (magenta) in the absence and presence of 50 nM IFNα2 are shown. The diagram above indicates the possible different species detected in each channel before (left) and after (right) addition of the ligand, taking unlabeled IFNAR1 and IFNAR2 into account. (d) Formation and dissociation of an individual IFNAR1-IFNAR2 dimer in the presence of IFNα2 as observed by an overlay of the individual trajectories (left) and by a distance analysis (right). Shown is a representative curve from >25 curves analyzed. (e) Relative number of colocomotion trajectories for dual-labeled IFNAR2 (positive control) and noninteracting proteins (negative control), as well as IFNAR1 and IFNAR2, in the absence and presence of IFNα2. The box plot indicates the data distribution of the second and third quartile (box), median (line), mean (filled square), and whiskers (1.5× interquartile range). (f) Diffusion properties represented as step-length distribution of IFNAR1 (left; from >800 trajectories) and IFNAR2 (right; from >500 trajectories) in the absence and presence of IFNα2. For comparison, the step-length distribution of colocomotion trajectories (+IFNα2) is shown (from ∼100 trajectories).
Figure 4.
Figure 4.
IFNAR dimerization observed for different IFN subtypes and mutants. (a) Relative number of colocomotion trajectories detected in the absence of ligand, in the presence of wt IFNα2, and in several IFNα2 mutants with increased and decreased binding affinities toward IFNAR1and IFNβ (each 50 nM) and IFNα2-M148A (200 nM). The broken line separates different types of mutants. (b) Affinity–dimerization relationship and plot of the law of mass action for naive and primed cells (data points are mean values taken from d). Dimerization for IFNβ is included as well as for IFNα2-wt under JAK inhibition. (c) Receptor dimerization in U5AIFNAR1/IFNAR2 cells in the absence and presence of 50 nM IFNα2, and after priming and ectopic expression of (EGFP)-USP18. (d) Comparison of colocomotion events for 50 nM IFNα2-wt and mutants observed with naive (red) and primed cells (blue). Box plots indicate the data distribution of the second and third quartile (box), median (line), mean (closed squares), and whiskers (1.5× interquartile range).
Figure 5.
Figure 5.
The role of Jak1 in stabilizing the ternary complex. (a) Receptor dimerization by IFNα2 (blue) and IFNα2-YNS (red) for full-length (fl) IFNAR2, IFNAR2 truncated after the Jak1 binding site (Δ346), and after the transmembrane domain (Δ265). (b and c) Binding of 2 nM DY647IFNα2-M148A (b) and DY647IFNα2-dn (c) to cell lines deficient in Jak1 (U4C) and IFNAR2 (U5A). For comparison, binding to the parental cell line (2fTGH) and to U4C complemented with Jak1 is shown. Box plots indicate the data distribution of the second and third quartile (box), median (line), mean (closed squares), and whiskers (1.5× interquartile range).
Figure 6.
Figure 6.
Functional consequences of USP18-mediated interference with ternary complex assembly. (a and b) Western blot analysis of STAT1 and STAT2 phosphorylation in parental HLLR1 cells versus cells stably expressing USP18 (HU13) stimulated with IFNα2-wt, -R120A, or -M148A. (c and d) Dose–response curve for pSTAT normalized to total STAT calculated from the band intensities in the Western blot (representative data from three independent experiments). Values were normalized to those obtained at the highest dose of IFN wt, which was taken as 100%. The broken lines represent the curve extrapolations for lower IFN doses expected from independent experiments.

Similar articles

Cited by

References

    1. Abramovich C., Chebath J., and Revel M.. 1994. The human interferon α-receptor protein confers differential responses to human interferon-β versus interferon-α subtypes in mouse and hamster cell transfectants. Cytokine. 6:414–424. 10.1016/1043-4666(94)90066-3 - DOI - PubMed
    1. Appelhans T., Richter C.P., Wilkens V., Hess S.T., Piehler J., and Busch K.B.. 2012. Nanoscale organization of mitochondrial microcompartments revealed by combining tracking and localization microscopy. Nano Lett. 12:610–616. 10.1021/nl203343a - DOI - PubMed
    1. Beutel O., Nikolaus J., Birkholz O., You C., Schmidt T., Herrmann A., and Piehler J.. 2014. High-fidelity protein targeting into membrane lipid microdomains in living cells. Angew. Chem. Int. Ed. Engl. 53:1311–1315. 10.1002/anie.201306328 - DOI - PubMed
    1. Brooks A.J., Dai W., O’Mara M.L., Abankwa D., Chhabra Y., Pelekanos R.A., Gardon O., Tunny K.A., Blucher K.M., Morton C.J., et al. . 2014. Mechanism of activation of protein kinase JAK2 by the growth hormone receptor. Science. 344:1249783 10.1126/science.1249783 - DOI - PubMed
    1. Brown R.J., Adams J.J., Pelekanos R.A., Wan Y., McKinstry W.J., Palethorpe K., Seeber R.M., Monks T.A., Eidne K.A., Parker M.W., and Waters M.J.. 2005. Model for growth hormone receptor activation based on subunit rotation within a receptor dimer. Nat. Struct. Mol. Biol. 12:814–821. 10.1038/nsmb977 - DOI - PubMed

Publication types