. 2015 Jun 20;6(17):15464-81.
doi: 10.18632/oncotarget.3895.

Cannabinoid receptor CB1 regulates STAT3 activity and its expression dictates the responsiveness to SR141716 treatment in human glioma patients' cells

Affiliations

Cannabinoid receptor CB1 regulates STAT3 activity and its expression dictates the responsiveness to SR141716 treatment in human glioma patients' cells

Elena Ciaglia et al. Oncotarget. .

Abstract

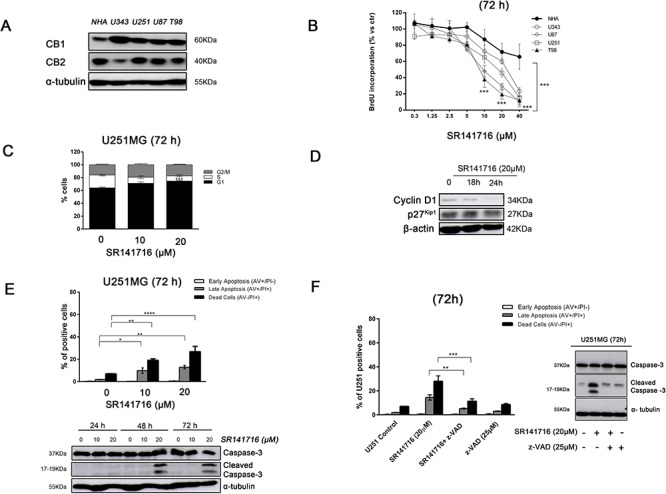
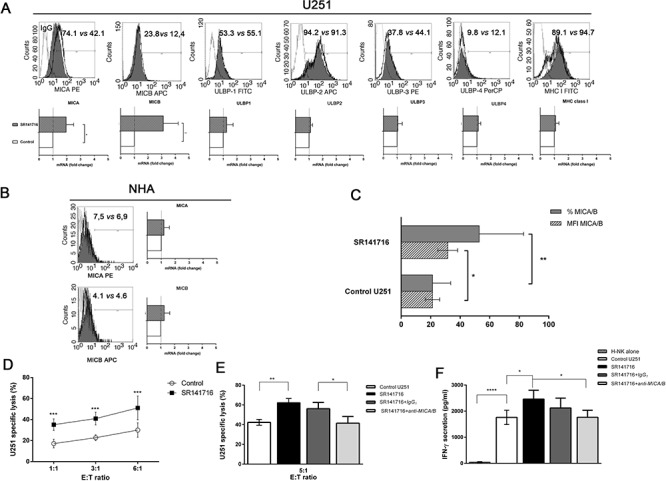
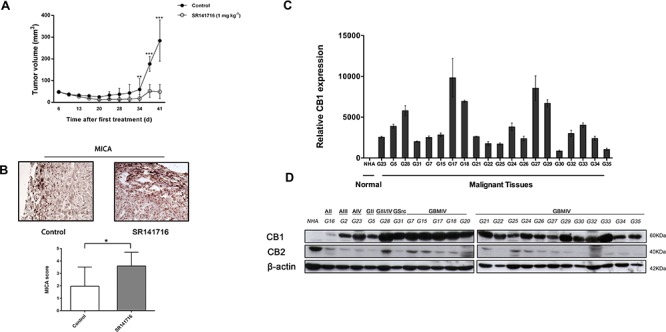
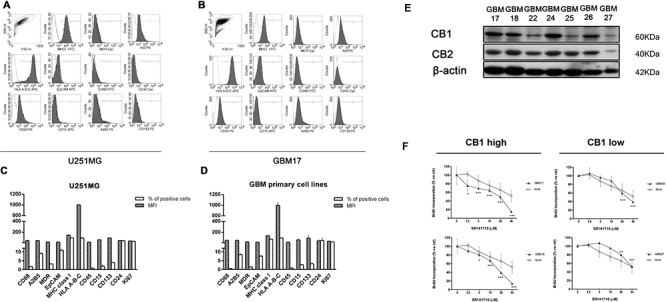
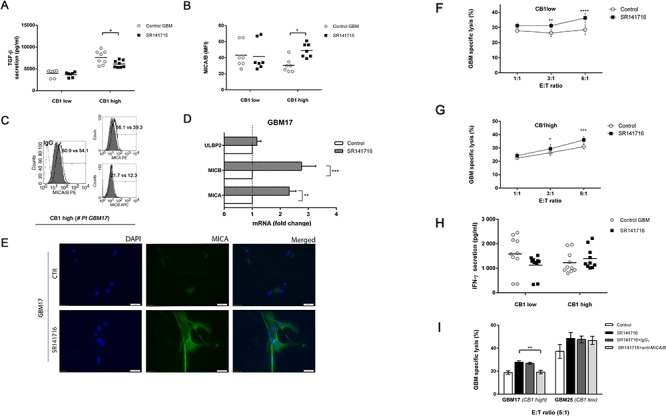
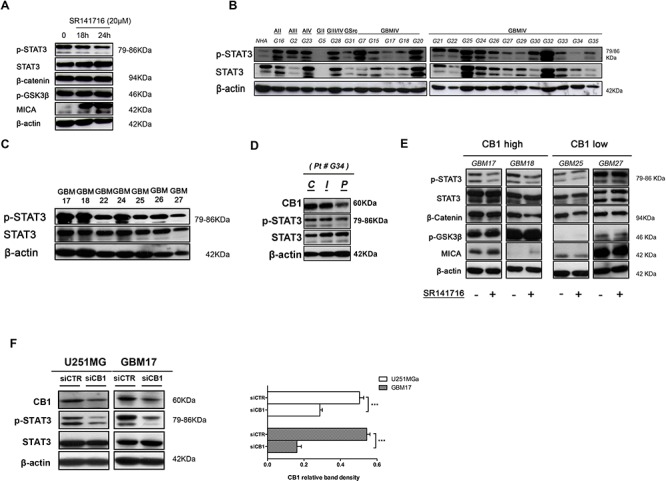
Herein we show that a majority of human brain tumor samples and cell lines over-expressed cannabinoid receptor CB1 as compared to normal human astrocytes (NHA), while uniformly expressed low levels of CB2. This finding prompted us to investigate the therapeutic exploitation of CB1 inactivation by SR141716 treatment, with regard to its direct and indirect cell-mediated effects against gliomas. Functional studies, using U251MG glioma cells and primary tumor cell lines derived from glioma patients expressing different levels of CB1, highlighted SR141716 efficacy in inducing apoptosis via G1 phase stasis and block of TGF-β1 secretion through a mechanism that involves STAT3 inhibition. According to the multivariate role of STAT3 in the immune escape too, interestingly SR141716 lead also to the functional and selective expression of MICA/B on the surface of responsive malignant glioma cells, but not on NHA. This makes SR141716 treated-glioma cells potent targets for allogeneic NK cell-mediated recognition through a NKG2D restricted mechanism, thus priming them for NK cell antitumor reactivity. These results indicate that CB1 and STAT3 participate in a new oncogenic network in the complex biology of glioma and their expression levels in patients dictate the efficacy of the CB1 antagonist SR141716 in multimodal glioma destruction.

Keywords: CB1; MICA; NK cells; STAT3; gliomas.


Conflict of interest statement

CONFLICTS OF INTEREST

The authors declare no competing financial interests.

Figures

Figure 1
Figure 1. Effect of SR141716 on growth and cellular integrity of human glioma cell lines and primary astrocytes
A. Basal expression of CB1 and CB2 and in normal human astrocytes (NHA) and different glioma cell lines (U343, U251, U87 and T98). Panel shows a representative western blot of 3 different experiments performed with similar results. α-tubulin serves as loading control. B. Glioma cell lines and NHA were cultured for 72 h in the presence of the indicated concentrations (0–40 μM) of SR141716 before analysis of cell proliferation by BrdU incorporation assay. Results are expressed as means ± SD of 3 independent experiments performed in triplicate and reported as percentage vs the untreated control (ANOVA, ***P < 0.001 vs control). C. Distribution of U251 glioma cells in the different phases of the cell cycle in SR141716-treated (10–20 μM) cells and in parallel untreated cultures. Histograms show the percentage of cells in each phase of the cell cycle. Results are representative of 3 independent experiments performed in duplicate, expressed as mean ± SD (ANOVA, ***P < 0.001 vs control). D. Time-dependent expression of cell cycle regulators cyclin D1 and p27Kip1 detected by Western blot. U251cells were treated with SR141716 (20 μM) for 18 h and 24 h. β-actin serves as loading control. Data are representative of 3 independent experiments performed with similar results. E. Induction of apoptosis measured by annexin V and propidium iodide (PI) double staining through flow cytometry in SR141716-treated U251 cells. Histograms indicate total percentage of early (Annexin V-positive cells/PI-negative cells) and late apoptotic events (Annexin V/PI-double positive cells) as well as necrotic cells (Annexin V-negative cells/PI-positive cells). Results are representative of 3 independent experiments performed in duplicate and expressed as mean ± SD (ANOVA, *P < 0.05, **P < 0.01 and ***P < 0.001) (upper panel). Concentration- and time-dependent increase of the apoptotic pathway by expression of cleaved caspase-3 determined by Western blot analysis. U251 glioma cells were treated with SR141716 (10–20 μM) for 24, 48, and 72 h. α-tubulin serves as loading control. Panel shows a representative blot of 3 different experiments performed with similar results (lower panel). F. Apoptosis induction (left panel) and caspase 3 cleavage (right panel) measured, as in E, in U251MG cells pretreated for 2 h with vehicle (DMSO, control) or the indicated concentrations of z-VAD-fmk and then treated with SR141716 (20 μM) for 72 h.
Figure 2
Figure 2. Phenotypic and functional significance of the upregulated expression of MICA/B on glioma cells treated with SR141716
A. Representative example for cytofluorimetric histogram profiles of MHCI, MICA, MICB, ULBP1, ULBP2, ULBP3, ULBP4 protein levels at the U251 cell surface of control (gray profiles) or cells treated with SR141716 20 μM for 24 h (empty profiles). Percentages of positive cells are indicated in the upper right corner and are representative of 3 independent experiments (upper panel). Real-time PCR analysis of total mRNA obtained from U251 cells, unstimulated or treated with SR141716 (20 μM) for 6 h. MHCI, MICA, MICB, ULBP1, ULBP2, ULBP3, ULBP4 mRNA expression were assessed. Data, expressed as fold change units, were normalized with GAPDH and referred to the untreated cells considered as calibrator. The mean of 4 independent experiments is shown (*P < 0.05, **P < 0.01 two-tailed Student's t test) (lower panel). B. Representative example for cytofluorimetric histogram profiles of MICA and MICB (left) and real-time PCR analysis (right) of the total mRNA obtained from NHA cells, unstimulated or treated with SR141716 (20 μM) as indicated in A. Data, expressed as fold change units, were normalized with GAPDH and referred to the untreated cells considered as calibrator. The mean of 4 experiments is shown. C. The mean fluorescence intensity (MFI) and the percentage of U251 positive cells for MICA/B were calculated based on at least 6 independent experiments and evaluated by ANOVA (*P < 0.05, **P < 0.01 compared with untreated cells). Bar graphs report mean values ± SD. D-F. SR141716 enhances NK cell-mediated cytotoxicity against U251 glioma cells. U251 cells were incubated for 24 h with SR141716 (20 μM) or control medium (untreated) prior to 4 h flow cytometric assay of NK-cell cytotoxicity at the indicated effector to target ratios (E:T), as described in Materials and Methods E and F Afterwards, supernatants were harvested and analyzed for IFN-γ by ELISA F. To evaluate the role of MICA/B, where indicated, blocking anti-MICA/B (SR141716+anti-MICA/B) or isotype control F(ab')2 fragments (SR141716+IgG1) were added before addition of NK cells E and F. Results were expressed as the mean ± SD of 4 independent experiments conducted in triplicate. All pairwise comparisons are statistically significant (ANOVA; *P < 0.05, **P < 0.01, ***P < 0.001).
Figure 3
Figure 3. Analysis of CB1 expression and of the effects of its pharmacological modulation in an in vivo setting
SR141716 reduces the growth of glioma xenograft. A. Effect of SR141716 20 μM on the growth of U87 cell-derived tumor xenografts [n = 10–12 for each condition; mean ± SD; SR141716-treated tumors were significantly different from vehicle, from day 34 until the end of the treatment (**P < 0.01, ***P < 0.001)]. B. Criosections (0, 7 mm) of luc-U87 explanted masses prepared at day 35 from vehicle (control) and SR141716-treated animals were stained with mAb directed against MICA. Magnification for all section was 20x and are representative of at least 3 different tumor sections for each treatment (upper panel). After 35 and 41 days from treatment beginning, 4 animals for each group were sacrificed for immunohistological analysis. Bar graphs in lower panel summarize IHC scores of MICA in xenograft specimens (*P < 0.05, two-tailed Student's t test) as reported in Material and Methods. CB1 is upregulated in gliomas tissues and primary cell lines compared with NHA. C. Real-time PCR analysis of CB1 in NHA and 20 glioma tissues (G5-G35). Data, expressed as fold change units, were normalized with β-actin and referred to the NHA considered as calibrator. Columns represent mean ± SD of the results performed in triplicates. D. Representative Western blot showing the basal protein levels of CB1 and CB2 in NHA and 23 tumor brains (G16 astrocytoma grade II, G2 astrocytoma grade III, G23 astrocytoma grade IV, G5 glioma grade II, G28 glioma grade III, G31 gliosarcoma, G7-G35 glioblastoma grade IV). β-actin was used as loading control.
Figure 4
Figure 4. CB1 expression in glioma patients derived-cells dictates the responsiveness to SR1417176 treatment
Phenotypic characterization of glioma primary cell lines. A-D. Glioma (GBM) primary cell lines used throughout the paper and U251for comparison were stained with the indicated antibodies followed by flow cytometric analysis. In all the experiments the isotype-matched controls were used to set up the negative values. A-B. Representative example for cytofluorimetric histogram profiles of U251 A and GBM17 B maintained in culture for 48 h (gray profiles). Open dot histograms represent isotype matched immunoglobulin staining. C-D. Bars graph reports mean ± SD of the mean fluorescence intensity (MFI) and percent of positivity for each marker in U251 C and in all different GBM primary cell lines used D. Results are representative of 3 independent experiments. E. Representative Western blot showing CB1 and CB2 protein levels in 7 human primary glioma cell lines established from the indicated cancer patients (G17, G18, G22, G24, G25, G26, G27). β-actin was used as loading control. F. Patients-derived primary cell lines were divided in two different groups reflecting their CB1 protein expression level [(GMB17, GBM18, GBM24, GBM26 CB1 high), (GBM22, GBM25, GBM27 CB1 low)]. 2 representative primary cell lines belonging to CB1 low (GBM25 and GBM27) and CB1 high (GBM17 and GBM18) cell groups respectively, and NHA were cultured for 72 h in the presence of the indicated concentrations (2.5–40 μM) of SR141716 20 μM before analysis of cell proliferation by BrdU incorporation assay. Results, reported as percentage, are expressed as mean ± SD of 3 independent experiments performed in triplicate. (ANOVA, **P < 0.01, ***P < 0.001 vs control).
Figure 5
Figure 5. SR141716 stimulates MICA and MICB transcription and cell surface expression on responsive CB1 high primary cell lines enhancing NK-cell mediated cytotoxicity against glioma patient cells
A. CB1 low (GBM22, GBM25, GBM27 CB1 low) and CB1 high (GMB17, GBM18, GBM24, GBM26) cell tumor primary cell lines were cultured for 24 h in the presence or absence of SR141716 20 μM before the determination of total TGF-β in cell culture supernatant by ELISA. Each dot represents the result from at least 2 different independent experiments for each indicated patient primary cell lines. B. MICA/B cell surface expression was analyzed by flow cytometry on CB1 low and CB1 high cells treated with SR141716 (20 μM) for 24 h. The mean fluorescence intensity (MFI) of MICA/B was calculated based on at least 2 different independent experiments for patient and evaluated by ANOVA (*P < 0.05, compared with untreated cells, control GBM). Each dot represents the result from at least 2 different independent experiments for each indicated patient primary cell lines. Bar graphs report mean values ± SD. C. Cell surface expression of total MICA/B or alternatively of MICA and MICB was analyzed by flow cytometry on one representative responsive patient's primary cell line (# GBM17) treated with SR141716 20 μM for 24 h. The gray-colored histograms represent basal expression of tot MICA/B, MICA or MICB whereas thick black-colored histograms represent the antigen expression after treatment with SR141716. D. Real-time PCR analysis of total mRNA obtained from GBM17 cells, unstimulated or treated with SR141716 20 μM for 6 h. MICA, MICB and ULBP2 mRNA expression was assessed. Data, expressed as fold change units, were normalized with GADPH and referred to the untreated cells considered as calibrator and represent the mean of 4 experiments (ANOVA, **P < 0.01, ***P < 0.001, compared with untreated cells, control). E. A representative patient's primary cell line (# GBM17) was cultured for 24 h in the presence or absence of SR141716 (20 μM). Subsequently, immunofluorescence analysis using the LEAF™ purified anti-human MICA/MICB (6D4) specific mAb followed by the secondary Alexa Fluor® 488-coniugate and DAPI for nuclear staining was performed. One representative experiment of a total of 3 is shown. Magnification, 20x. F-I. CB1 low F and CB1 high G cell groups were incubated for 18 h with or without SR141716 20 μM prior to 4 h flow cytometric assay of NK-cell cytotoxicity at the indicated effector to target ratios (E:T), as described in Materials and Methods. Afterwards, supernatants were harvested and analyzed for IFN-γ by ELISA. Each dot represents the result from at least 2 different independent experiments for each indicated patient primary cell lines H. To evaluate the role of MICA/B, as indicated in D, blocking anti-MICA/B (SR141716+anti-MICA/B) or isotype control F(ab')2 fragments (SR141716+IgG1) were added before addition of NK cells I. Results were expressed as the mean ± SD of 4 independent experiments conducted in triplicate. All pairwise comparisons are statistically significant (ANOVA; *P < 0.05, **P < 0.01, ***P < 0.001).
Figure 6
Figure 6. Cannabinoid receptor CB1 specifically regulates STAT3 activity
A. Inhibition of STAT3 pathway by CB1 targeting. U251 cells were stimulated for the indicated time with SR141716 20 μM and cell lysates were immunoblotted for p-STAT3, total STAT3, β-catenin, p-GSK3β, MICA and β-actin as loading control. Data are representative of 3 independent experiments performed with similar results. B. Representative Western blot showing the basal protein levels of p-STAT3 and total STAT3 in NHA and 23 tumor brains (G16 astrocytoma grade II, G2 astrocytoma grade III, G23 astrocytoma grade IV, G5 glioma grade II, G28 glioma grade III, G31 gliosarcoma, G7-G35 glioblastoma grade IV). β-actin was used as loading control. C. Representative Western blot showing phospho and total STAT3 protein levels in 7 human primary glioma cell lines established from the indicated cancer patients (G17, G18, G22, G24, G25, G26, G27). β-actin was used as loading control. D. Representative Western blot showing CB1, p-STAT3, total STAT3 protein levels in central tumor tissue C and in the corresponding intermediate peritumoral (I) and peripheral normal tissue specimen (P), approximately 1cm distant from tumor mass, of one representative patient. β-actin was used as loading control. E. Western blot analysis for p-STAT3, total STAT3, β-catenin, p-GSK3β and MICA on whole cell extracts from indicated primary cell lines treated with control medium or SR141716 (20 μM) for 24 h. β-actin was used as control of protein loading. Panel shows a representative Western blot of 2 different experiments performed with similar results. F. Western Blot analysis of STAT3 phosphorylation in siCTR- and siCB1 transfected U251 and GBM17 cells (left, 24 h); panel on the right shows the analysis of CB1 protein levels after transfection. β-actin was used as loading control. Panel shows a representative Western blot of 3 different experiments performed with similar results.

Similar articles

Cited by

References

    1. Kesari S. Understanding glioblastoma tumor biology: the potential to improve current diagnosis and treatments. Semin Oncol. 2011;38:S2–10. - PubMed
    1. Pisanti S, Picardi P, D'Alessandro A, Laezza C, Bifulco M. The endocannabinoid signaling system in cancer. Trends Pharmacol Sci. 2013;34:273–82. Review. - PubMed
    1. Velasco G, Sánchez C, Guzmán M. Towards the use of cannabinoids as antitumour agents. Nat Rev Cancer. 2012;12:436–44. - PubMed
    1. Katona I, Freund TF. Endocannabinoid signaling as a synaptic circuit breaker in neurological disease. Nat Med. 2008;14:923–30. - PubMed
    1. Aguado T, Monory K, Palazuelos J, Stella N, Cravatt B, Lutz B, Marsicano G, Kokaia Z, Guzmán M, Galve-Roperh I. The endocannabinoid system drives neural progenitor proliferation. FASEB J. 2005;19:1704–6. - PubMed

Publication types

MeSH terms