. 2015 Jun 10;6(16):14556-71.
doi: 10.18632/oncotarget.3989.

Tumor promotion by γ and suppression by β non-muscle actin isoforms

Affiliations

Tumor promotion by γ and suppression by β non-muscle actin isoforms

Vera Dugina et al. Oncotarget. .

Abstract

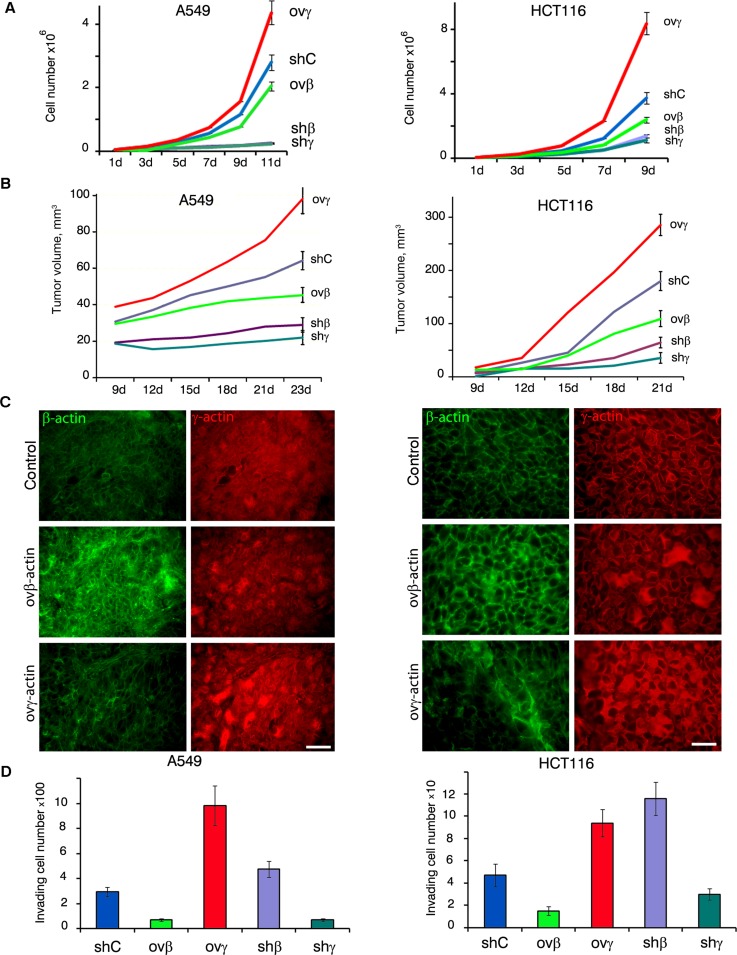
Here we have shown that β-cytoplasmic actin acts as a tumor suppressor, inhibiting cell growth and invasion in vitro and tumor growth in vivo. In contrast, γ-cytoplasmic actin increases the oncogenic potential via ERK1/2, p34-Arc, WAVE2, cofilin1, PP1 and other regulatory proteins. There is a positive feedback loop between γ-actin expression and ERK1/2 activation. We conclude that non-muscle actin isoforms should not be considered as merely housekeeping proteins and the β/γ-actins ratio can be used as an oncogenic marker at least for lung and colon carcinomas. Agents that increase β- and/or decrease γ-actin expression may be useful for anticancer therapy.

Keywords: ERK1/2; PP1; WAVE; actin isoforms; cancer; cofilin1; p34-Arc.


Conflict of interest statement

DISCLOSURE OF POTENTIAL CONFLICTS OF INTERESTS

Authors do not have any conflicts of interests.

Figures

Figure 1
Figure 1. Expression of cytoplasmic actins in normal and transformed cells (A-C); expression of cytoplasmic actins and HaCaT cellular characteristics (D-G)
A. Immunofluorescent staining for β-actin (green) and γ-actin (red) of representative pairs of NSCLC and Colon Cancer samples with matching normal tissue samples. Scale bars represent 50μm. Graphs represent staining intensity of biopsies (Mean ± SD). B. WB analysis of HaCaT cells with exogenous expression of active N-RasD13. Graphs represent relative actins expression (Mean ± SD). C. Immunofluorescent staining for β-actin (green) and γ-actin (red) of N-RasD13 transformed HaCaT cells. Scale bars represent 10 μm. D. WB analysis of HaCaT cells with exogenous expression of β- or γ-actins and corresponding shRNAs. shC is sh to GFP. Graphs represent relative actins expression (Mean ± SD). E. Semi-quantitative RT-PCR analysis of β- or γ-actins expression in cells with corresponding shRNAs. Graphs represent folds of RNA expression in comparison to control cells (Mean ± SD). F. Immunofluorescent staining of HaCaT cells with altered β- or γ-actins expression. Scale bars represent 10 μm. G. HaCaT cells with silenced or exogenously expressed non-muscle cytoplasmic actins that crossed the matrigel-coated membranes (left). Graphs represent mean ± SD. HaCaT proliferation dynamics with exogenous expression or silenced of β- or γ-actins (right). Error bars are SD.
Figure 2
Figure 2. β- and γ-actins in neoplastic cells phenotype
A. WB analysis of A549 cells (left panel) and HCT116 cells (right panel) with exogenous expression of β- or γ-actins and corresponding shRNAs. Graphs represent relative actins expression (Mean ± SD). B. Semi-quantitative RT-PCR analysis of β- or γ-actins expression in A549 (left panel) and HCT116 (right panel) with corresponding shRNAs. Graphs represent folds of RNA expression in comparison to control cells (Mean ± SD). C. Immunofluorescent staining of A549 cells (left panel) and HCT116 cells (right panel) with exogenous expression of β- or γ-actins and corresponding shRNAs. Scale bars represent 10 μm.
Figure 3
Figure 3. β- and γ-actins in malignant growth
A. Proliferation dynamics of A549 (left panel) and HCT116 (right panel) cells with exogenous expression or silenced of β- or γ-actins. Error bars are SD. B. Dynamics of xenographt growth after subcutaneous injection (10 mice per group) of A549 (left panel) and HCT116 (right panel) cells with exogenous expression or silenced of β- or γ-actins. Error bars are SD. C. Immunofluorescent staining for β-actin (green) and γ-actin (red) of tumors xenographts after 23 days of subcutaneous growth. Scale bars represent 50 μm. D. Invasion of A549 (left panel) and HCT116 cells through matrigel-coated membranes (Mean ± SD).
Figure 4
Figure 4. γ-actin and ERK1/2 are mutually regulated
A. WB analysis of A549 cells with exogenous expression of β- or γ-actins and corresponding shRNAs. Graphs represent relative pERK1/2 expression (Mean ± SD). B. LSM of A549 cells with down-regulated β- or γ-actins with β-actin (green), γ-actin (purple) or pERK1/2 (red) immunofluorescent staining. Scale bars represent 10 μm. C. pERK1/2 immunoprecipitation analysis of A549 cells with down-regulated β- or γ-actins. D. pERK1/2/γ-actin PLA analysis of A549 cells with down-regulated β- or γ-actins. Scale bar represents 10 μm. Graph represents relative fluorescence intensity (Mean ± SD). E. LSM of A549 cells treated with EGF or UO126 with β-actin (green) or γ-actin (red) immunofluorescent staining. Scale bars represent 10 μm. F. WB analysis of A549 cells treated with EGF or UO126. Graphs represent relative pERK1/2 or β-/γ-actin levels (Mean ± SD).
Figure 5
Figure 5. γ-actin co-localizes with p34-Arc and WAVE2 and regulates them
A. p34-Arc (red) or γ-actin (green) immunofluorescence images of A549 cells with down-regulated β- or γ-actins. Scale bars represent 10 μm. B. γ-Actin (red) or WAVE2 (green) immunofluorescence images of A549 cells with down-regulated β- or γ-actins. Scale bars represent 10 μm. C. WB analysis of A549 cells with down-regulated β- or γ-actins. Graphs represent relative protein levels (Mean ± SD). D. p34-Arc immunoprecipitation analysis of A549 cells with down-regulated β- or γ-actins. E. WAVE2 immunoprecipitation analysis of A549 cells with down-regulated β- or γ-actins. F. LSM of A549 cells with down-regulated β-actin with p34-Arc (green, upper panel), WAVE2 (green, lower panel), β-actin (red) or γ-actin (purple) immunofluorescent staining. Scale bars represent 2μm. Asterisk marks the cell with silenced β-actin.
Figure 6
Figure 6. γ-actin co-localizes with cofilin1 and regulates it
A. LSM of A549 cells with down-regulated β- or γ-actins with β-actin (green), γ-actin (purple), cofilin1 (red) or DAPI (blue) immunofluorescent staining. Scale bars represent 10 μm. B. WB analysis of A549 cells with down-regulated β- or γ-actins. Graphs represent relative protein levels (Mean ± SD). C. Cofilin1 immunoprecipitation analysis of A549 cells with down-regulated β- or γ-actins. D. Cofilin1/γ-actin PLA analysis of A549 cells with down-regulated β- or γ-actins. Scale bar represents 10 μm. Graph represents relative fluorescence intensity (Mean ± SD).
Figure 7
Figure 7. γ-actin co-localizes with PP1 and regulates it
A. LSM of A549 cells with down-regulated β- or γ-actins with β-actin (green), γ-actin (purple), PP1α (red) or DAPI (blue) immunofluorescent staining. Scale bars represent 10 μm. B. WB analysis of A549 cells with down-regulated β- or γ-actins. Graphs represent relative PP1α levels (Mean ± SD). C. PP1 immunoprecipitation analysis of A549 cells with down-regulated β- or γ-actins. D. PP1α/γ-actin (upper panel) and PP1α/β-actin PLA analysis of A549 cells with down-regulated β- or γ-actins. Scale bar represents 10 μm. E. Comparative quantification of PP1α−β-/γ-actin PLA dots. Graph represents relative fluorescence intensity (Mean ± SD).
Figure 8
Figure 8. (SCHEME)
In cancer cells the ratio of non-muscle cytoplasmic β- and γ-actins shifts towards γ-actin predominance. γ-Actin (unlike β-actin) can interact with both structural (components of Arp2/3 and WAVE2 complexes, cofilin1 that is dispensable for movement and cellular architecture) and signaling proteins (ERK1/2, PP1). Upon malignant transformation γ-actin becomes overexpressed. The cell acquires a more mesenchymal phenotype. It becomes more invasive and grows faster both in vitro and in vivo. β-Actin predominance in a transformed cell has an opposite effect: a more “normal” epithelial phenotype, impaired invasion and growth. γ-Actin could be considered as a weak oncogene and β-actin as an anti-oncogene.

Similar articles

Cited by

References

    1. Otranto M, Sarrazy V, Bonté F, Hinz B, Gabbiani G, Desmoulière A. The role of the myofibroblast in tumor stroma remodeling. Cell Adh Migr. 2012;6:203–219. - PMC - PubMed
    1. Vandekerckhove J, Weber K. At least six different actins are expressed in a higher mammal: an analysis based on the amino acid sequence of the amino-terminal tryptic peptide. J Mol Biol. 1978;126:783–802. - PubMed
    1. Rubenstein PA. The functional importance of multiple actin isoforms. Bioessays. 1990;12:309–315. - PubMed
    1. Harborth J, Elbashir SM, Bechert K, Tuschl T, Weber K. Identification of essential genes in cultured mammalian cells using small interfering RNAs. J Cell Sci. 2001;114:4557–4565. - PubMed
    1. Khaitlina SY. Functional specificity of actin isoforms. Int Rev Cytol. 2001;202:35–98. - PubMed

Publication types

LinkOut - more resources