. 2015 May 26:6:7223.
doi: 10.1038/ncomms8223.

Piezo1 ion channel pore properties are dictated by C-terminal region

Affiliations

Piezo1 ion channel pore properties are dictated by C-terminal region

Bertrand Coste et al. Nat Commun. .

Abstract

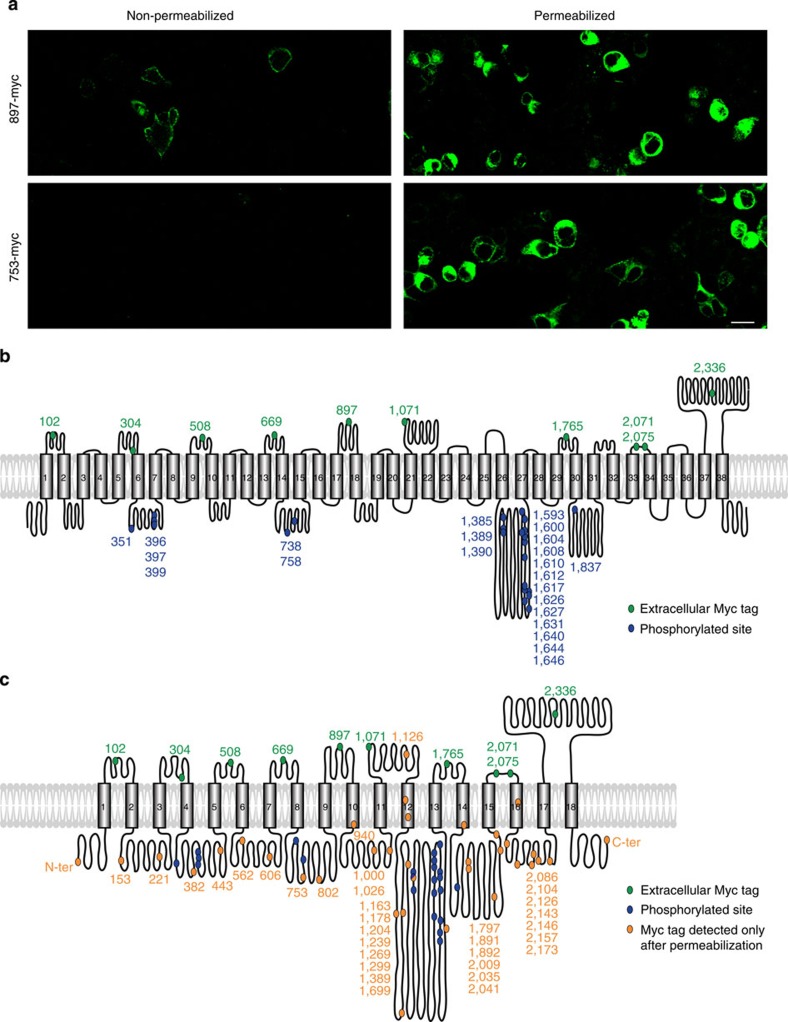
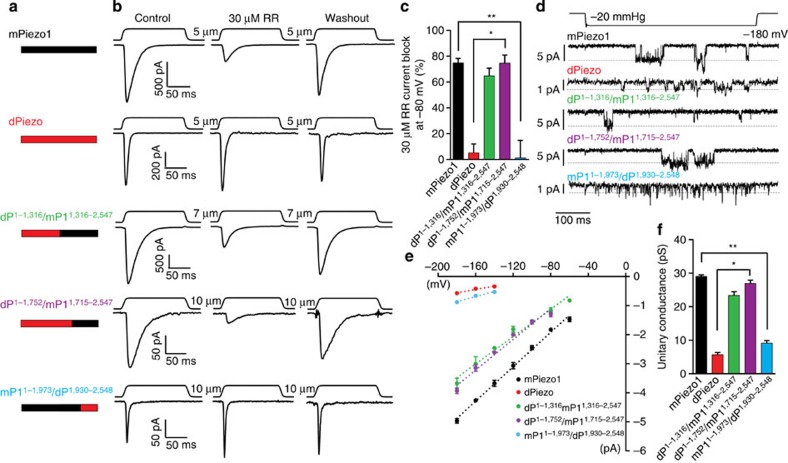
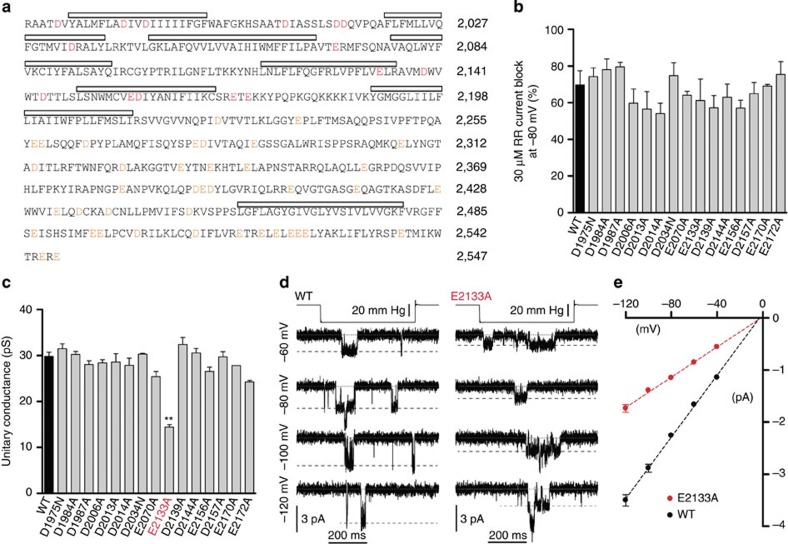
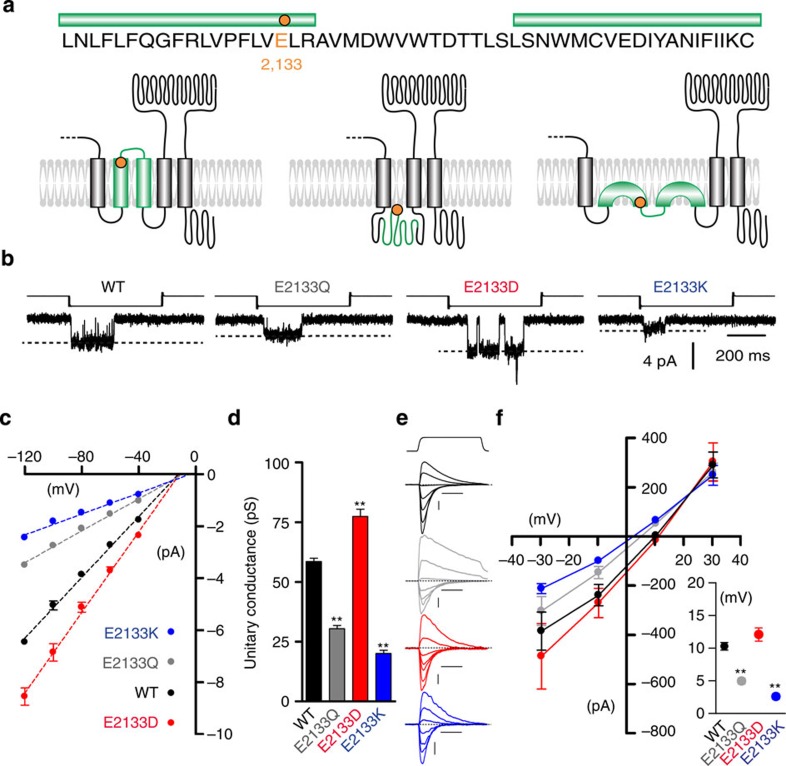
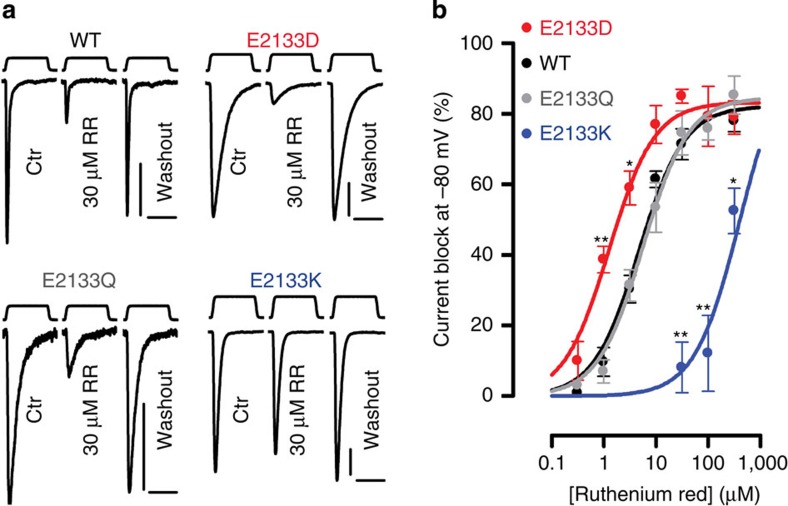
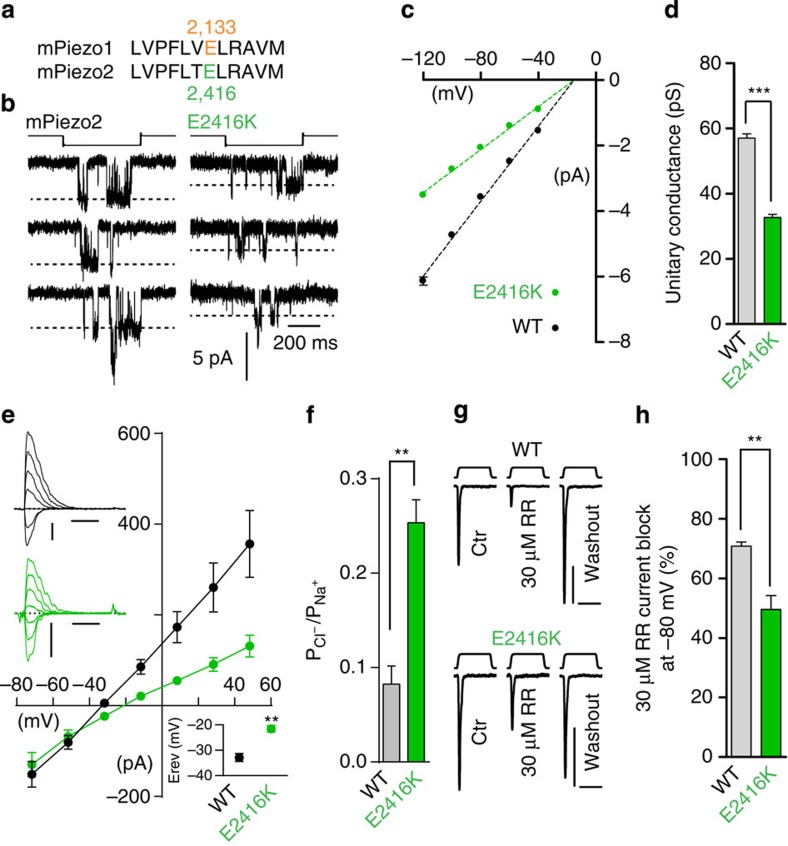
Piezo1 and Piezo2 encode mechanically activated cation channels that function as mechanotransducers involved in vascular system development and touch sensing, respectively. Structural features of Piezos remain unknown. Mouse Piezo1 is bioinformatically predicted to have 30-40 transmembrane (TM) domains. Here, we find that nine of the putative inter-transmembrane regions are accessible from the extracellular side. We use chimeras between mPiezo1 and dPiezo to show that ion-permeation properties are conferred by C-terminal region. We further identify a glutamate residue within a conserved region adjacent to the last two putative TM domains of the protein, that when mutated, affects unitary conductance and ion selectivity, and modulates pore block. We propose that this amino acid is either in the pore or closely associates with the pore. Our results describe important structural motifs of this channel family and lay the groundwork for a mechanistic understanding of how Piezos are mechanically gated and conduct ions.


Figures

Figure 1
Figure 1. Transmembrane topology of mPiezo1.
(a) Representative images (three experimental replicates) of Myc labelling in mPiezo1-Myc transfected HEK293T cells. Myc tags were inserted at position 897 (upper panels) or 753 (lower panels). Immunostaining was performed prior (left panels) or after (right panels) cell permeabilization. Scale bar, 20 μm. (b,c) Schematic of transmembrane topology of mPiezo1 protein showing positions of Myc tags detected extracellularly (green) and phosphorylated sites detected by mass spectrometry (blue). (c) Positions of Myc tags detected only after permeabilization (orange) are shown.
Figure 2
Figure 2. Ruthenium red sensitivity and single-channel properties of mPiezo1 and dPiezo chimeras.
(a) Schematic representations illustrating portions of the protein sequence from mPiezo1 (black) or dPiezo (red) for each construct. (b) Representative (from five to eight experimental replicates) MA current traces at −80 mV from cells transfected with constructs shown in a before, during or after application of 30 μM RR. Each trace is an average of —three to five trials. Probe stimulation displacements are indicated. (c) Percent inhibition of MA currents in cells transfected with specified constructs in the presence of 30 μM RR (n=8, 5, 6, 5 and 5; mean±s.e.m.). One-way analysis of variance (ANOVA) with Dunn's comparison with mPiezo1 or dPiezo, *P<0.05, **P<0.01. (d) Representative (from five to seven experimental replicates) stretch-activated channel openings elicited at −180 mV from cells transfected with specified constructs. dPiezo and mP11–1,973/dP1,930–2,548 traces are displayed after applying 1 kHz digital filter. (e) Average I–V relationships of stretch-activated single channels in cells transfected with specified constructs. Single-channel amplitude was determined as the amplitude difference in Gaussian fits of full-trace histograms. (f) Unitary conductance of stretch-activated channels from cells transfected with specified constructs. Conductance is calculated from the slope of linear regression line of individual cell single-channel I–V relationships (n=7, 5, 5, 5 and 6; mean±s.e.m.). One-way ANOVA with Dunn's comparison with mPiezo1 or dPiezo, *P<0.05, **P<0.01.
Figure 3
Figure 3. Neutralization of mPiezo1 acidic residues.
(a) Protein sequence of mPiezo1 C-terminal region beginning at residue 1,971. Mutated acidic residues and other acidic residues are highlighted (red and orange, respectively). Grey bars indicate hydrophobic regions. (b) Average block of MA currents at −80 mV by 30 μM RR in cells transfected with mPiezo1 WT and specified mutants (n=2–6, mean±s.e.m.). (c) Unitary conductance of stretch-activated channels in cells transfected with WT mPiezo1 and specified mutants. Conductance is calculated from the slope of linear regression line of individual cell single-channel I–V relationships (n=3–13, mean±s.e.m.; One-way analysis of variance (ANOVA) with Dunn's comparison to WT, **P<0.01). (d) Representative (from 13 and 5 experimental replicates) stretch-activated channel openings elicited at specified potentials from mPiezo1 WT and E2133A transfected cells. (e) Average I–V relationships of stretch-activated single channels in mPiezo1 WT and E2133A transfected cells (n=13 and 5, respectively; mean±s.e.m.). Single-channel amplitude was determined as the amplitude difference in Gaussian fits of full-trace histograms.
Figure 4
Figure 4. Mutations of a conserved glutamate residue alter mPiezo1 pore properties.
(a) Protein sequence surrounding E2133 with putative topology models of mPiezo1 C-ter region. E2133 is highlighted (orange) and green bars indicate hydrophobic regions. (b) Representative (from four to seven experimental replicates) stretch-activated channel openings at −80 mV from cells transfected with mPiezo1 WT, E2133Q, E2133D and E2133K. Stimulation intensities are −15, −10, −20 and −50 mm Hg, respectively. (c) Average I–V relationships of stretch-activated single channels in cells transfected with mPiezo1 WT, E2133Q, E2133D and E2133K (n=7, 5, 5 and 4, respectively; mean±s.e.m.). Single-channel amplitude was determined as the amplitude difference in Gaussian fits of full-trace histograms. (d) Unitary conductance calculated from the slope of linear regression line of individual cells (mean±s.e.m.; One-way analysis of variance (ANOVA) with Dunn's comparison to WT, **P<0.01). (e) Representative (from six to nine experimental replicates) traces of MA currents recorded with 150 mM CsCl-based intracellular solution and 100 mM CaCl2 extracellular solution from mPiezo1 WT (black), E2133Q (grey), E2133D (red) and E2133K (blue) transfected cells. Currents are elicited from −69.6 to +50.4 mV, Δ20 mV. Scale bars, 100 pA, 50 ms. Probe stimulation displacements are 3, 4, 6 and 7 μm, respectively. (f) Average I–V relationships of MA currents recorded from mPiezo1 WT, E2133Q, E2133D and E2133K expressing cells with 150 mM CsCl-based intracellular solution and 100 mM CaCl2 extracellular solution (n=8, 6, 6 and 9, respectively). Inset: average reversal potentials from individual cells corresponding to experiments in f (WT: 10.3±0.6 mV; E2133Q: 5.0±0.5 mV; E2133D: 12.1±1.0 mV and E2133K: 2.6±0.4 mV; mean±s.e.m.; One-way ANOVA with Dunn's comparison with WT, **P<0.01). Experiments shown in b, c and d were performed in cell-attached configuration with Na+ as the only permeating cation in the recording pipette.
Figure 5
Figure 5. RR sensitivity of E2133 mutants.
(a) Representative (from 3 to 10 experimental replicates) MA current traces from cells transfected with mPiezo1 WT, E2133Q, E2133D and E2133K at −80 mV before, during or after application of 30 μM RR. Each trace is an average of two to four trials. Probe stimulation displacements are 4.5, 5, 6 and 8 μm, respectively. Scale bars, 300 pA, 100 ms. (b) RR concentration–inhibition curves on MA currents at −80 mV in cells transfected with specified constructs (n=2–10 per data point; mean±s.e.m.). One-way analysis of variance (ANOVA) with Dunn's comparison with WT done separately for each RR concentration, **P<0.01, *P<0.05.
Figure 6
Figure 6. Lysine substitution of E2416 alters pore properties of mPiezo2 channels.
(a) Conservation of mPiezo1 E2133 at position 2,416 on mPiezo2 protein. (b) Representative (from nine and six experimental replicates) stretch-activated channel openings at −80 mV from cells transfected with mPiezo2 WT and E2416K. Stimulation intensities are −15 and −20 mm Hg, respectively. (c) Average I–V relationships of stretch-activated single channels in mPiezo2 WT and E2416K transfected cells (n=9 and 6, respectively; mean±s.e.m.). Single-channel amplitude was determined as the amplitude difference in Gaussian fits of full-trace histograms. (d) Single-channel conductance calculated from the slope of linear regression line of individual cell single-channel I–V relationships (mean±s.e.m.; Mann–Whitney test, ***P<0.001). (e) Average I–V relationships of MA currents recorded from mPiezo2 WT and E2416K expressing cells with 150 mM NaCl-based intracellular solution and 30 mM NaCl extracellular solution. Top left inset: typical recording traces for WT (black) and E2416K (green) from −71.7 to +48.3 mV, Δ20 mV. Scale bars, 100 pA, 50 ms. Probe stimulation displacements are 9 and 8 μm, respectively. Bottom right inset: average reversal potential (mean±s.e.m.; n=6 and 5, respectively; Mann–Whitney test **P<0.01). (f) PCl/PNa permeability ratios of MA currents from cell transfected with mPiezo2 WT, and E2416K (mean±s.e.m.; n=6 and 5, respectively; Mann–Whitney test **P<0.01). (g) Representative (from five experimental replicates) MA current traces from mPiezo2 WT and E2416K transfected cells at −80 mV before, during or after application of 30 μM RR. Each trace is an average of two to four trials. Probe stimulation displacements are 5 and 7 μm, respectively. Scale bars, 100 pA, 100 ms. (h) Average block of MA currents at −80 mV by 30 μM RR in mPiezo2 WT and E2416K transfected cells (n=5 for each; mean±s.e.m.; Mann–Whitney test, **P<0.01). Experiments shown in b, c and d were performed in cell-attached configuration with Na+ as the only permeating cation in the recording pipette.

References

    1. Kim S. E., Coste B., Chadha A., Cook B. & Patapoutian A. The role of Drosophila Piezo in mechanical nociception. Nature 483, 209–212 (2012). - PMC - PubMed
    1. Faucherre A., Nargeot J., Mangoni M. E. & Jopling C. piezo2b regulates vertebrate light touch response. J. Neurosci. 33, 17089–17094 (2013). - PMC - PubMed
    1. Ikeda R. et al. Merkel cells transduce and encode tactile stimuli to drive abeta-afferent impulses. Cell 157, 664–675 (2014). - PMC - PubMed
    1. Maksimovic S. et al. Epidermal Merkel cells are mechanosensory cells that tune mammalian touch receptors. Nature 509, 617–621 (2014). - PMC - PubMed
    1. Woo S. H. et al. Piezo2 is required for Merkel-cell mechanotransduction. Nature 509, 622–626 (2014). - PMC - PubMed

Publication types