. 2015 Jun;36(6):1245-59.
doi: 10.1088/0967-3334/36/6/1245. Epub 2015 May 26.

Investigation of potential artefactual changes in measurements of impedance changes during evoked activity: implications to electrical impedance tomography of brain function

Affiliations

Investigation of potential artefactual changes in measurements of impedance changes during evoked activity: implications to electrical impedance tomography of brain function

Kirill Y Aristovich et al. Physiol Meas. 2015 Jun.

Abstract

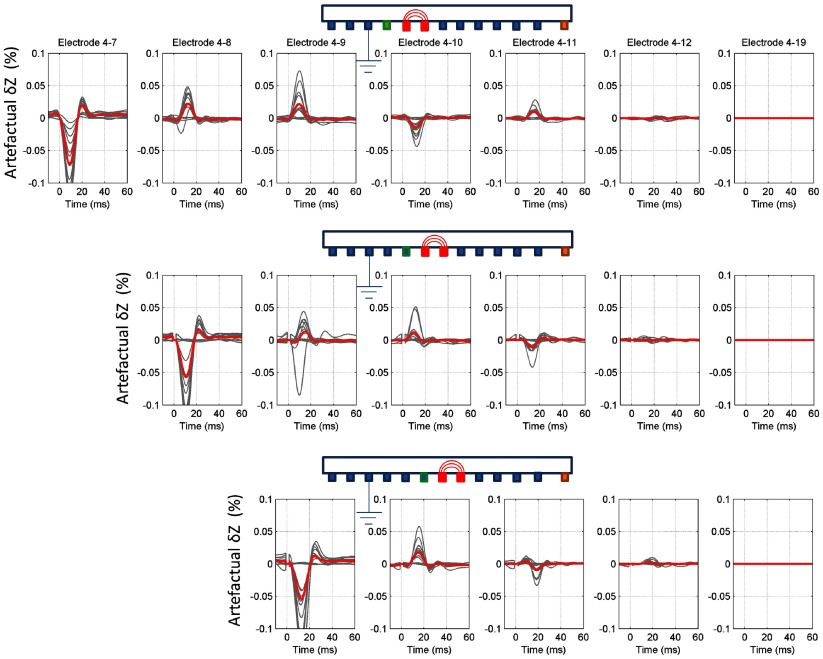
Electrical impedance tomography (EIT) could provide images of fast neural activity in the adult human brain with a resolution of 1 ms and 1 mm by imaging impedance changes which occur as ion channels open during neuronal depolarization. The largest changes occur at dc and decrease rapidly over 100 Hz. Evoked potentials occur in this bandwidth and may cause artefactual apparent impedance changes if altered by the impedance measuring current. These were characterized during the compound action potential in the walking leg nerves of Cancer pagurus, placed on Ag/AgCl hook electrodes, to identify how to avoid artefactual changes during brain EIT. Artefact-free impedance changes (δZ) decreased with frequency from -0.045 ± 0.01% at 225 Hz to -0.02 ± 0.01% at 1025 Hz (mean ± 1 SD, n = 24 in 12 nerves) which matched changes predicted by a finite element model. Artefactual δZ reached c.300% and 50% of the genuine membrane impedance change at 225 Hz and 600 Hz respectively but decreased with frequency of the applied current and was negligible above 1 kHz. The proportional amplitude (δZ (%)) of the artefact did not vary significantly with the amplitude of injected current of 5-20 µA pp. but decreased significantly from -0.09 ± 0.024 to -0.03 ± 0.023% with phase of 0 to 45°. For fast neural EIT of evoked activity in the brain, artefacts may arise with applied current of >10 µA. Independence of δZ with respect to phase but not the amplitude of applied current controls for them; they can be minimized by randomizing the phase of the applied measuring current and excluded by recording at >1 kHz.


Figures

Figure 1.
Figure 1.
The nerve was placed on the electrode array 1:19 with the electrodes spaced 4 mm apart. Stimulation electrodes 1–2 triggered the CAP; electrode 3, the earth, removed the stimulation artefact; electrodes 4:19 were current injection or voltage measuring electrodes. In the figure, the artefact-free method is shown, with current injected between electrodes 5–6, and measurement between electrodes 4–19.
Figure 2.
Figure 2.
Illustration of artefactual changes in the crab nerve. The CAP propagates along the nerve together with the conductivity change perturbation caused by ion channels opening, and its amplitude gradually decreases towards the end of the nerve (ac). If it is affected by the current when passing through the area where the current is injected (d, e), the raw measured voltage comprises the standing (background) potential modulated by the impedance change and is superimposed with the CAP, which is impossible to eliminate with averaging and subtraction, because the modified CAP contains the exact frequency and phase of the injected current (e). The resulting demodulated voltage will be contaminated by these changes, if measured with the electrodes located distally to the current injecting electrodes (d). The effect is negligible by the electrode 19 at end of the nerve where CAP is negligibly small and so cannot affect the measurements.
Figure 3.
Figure 3.
Resistor model and FEM used to simulate impedance change propagation in the nerve. For the resistor model, the nerve (a) was modelled as a long cable, discretized at each electrode (c) with intracellular resistance (ri), extracellular resistance (re), membrane resistance (rm), and contact impedance (rc). In the FEM, the heterogeneous impedance of the nerve fibres was mapped (b) into the effective homogeneous impedance of the axisymmetric cylinder (d), with intra- and extracellular resistance (ρi, ρe), membrane impedance (ρm, Ce), contact impedance (ρc, Cc), and electrode resistivity (ρe). During the activity, the perturbation with parameters (ρp, Cp, rp) moved with constant velocity 2 m s−1 along the nerve.
Figure 4.
Figure 4.
Summary of the recordings and controls taken at different frequencies. The artefact-free recordings (electrodes 4–19) were validated by comparing with simulations (a), recordings made with the last electrode being closer (b), and the first electrode further away (c) from the injection site. For the artefact-free method, there was no significant difference between consecutive pairs either way. The recordings, affected by the artefact can be clearly distinguished (electrodes 4–7 and 4–8, b). Grey traces represent each individual measurement, and the thick red trace represents the average impedance measurement across 30 recordings in 12 nerves.
Figure 5.
Figure 5.
Extracted artefactual changes at 225 Hz (the largest artefact) at different current injection locations. Top row shows measurements with current being injected between electrodes 5–6, middle row—electrodes 6–7, and bottom row—electrodes 7–8. Grey traces represent individual measurements, and the red trace is the average across 24 measurements in 12 nerves.
Figure 6.
Figure 6.
Artefactual changes with respect to frequency. The peak artefact in % with respect to the genuine impedance size (top, mean and standard deviation, N = 10 in four nerves), and artefact-affected area (bottom), approximated as the distance to the electrode where artefact becomes non-significant across N = 10.
Figure 7.
Figure 7.
Net artefactual change analysis performed at 225 Hz. (a) Peak amplitude of the artefactual changes with respect to the injected current amplitude, mean and standard deviation (n = 10 in four nerves for each value, colours represent different injection electrodes), (b) latency of the peak of artefactual change with respect to the distance between stimulating and current injecting electrode (n = 8 in four nerves for each value, colour lines represent different current amplitudes), and (c) Peak amplitude of the artefactual changes with respect to the current injection phase, mean and standard deviation (n = 10 in four nerves for each value, colours represent different injection electrodes).

References

    1. Cole K S, Curtis H J. Electric impedance of the squid giant axon during activity. J. Gen. Physiol. 1939;22:649–70. doi: 10.1085/jgp.22.5.649. - DOI - PMC - PubMed
    1. Edwards D, Cortes M, Datta A, Minhas P, Wassermann E M, Bikson M. Physiological and modeling evidence for focal transcranial electrical brain stimulation in humans: a basis for high-definition tDCS. Neuroimage. 2013;74:266–75. doi: 10.1016/j.neuroimage.2013.01.042. - DOI - PMC - PubMed
    1. Freygang W H, Jr, Landau W M. Some relations between resistivity and electrical activity in the cerebral cortex of the cat. J. Cell. Comp. Physiol. 1955;45:377–92. doi: 10.1002/jcp.1030450305. - DOI - PubMed
    1. Galambos R, Velluti R. Evoked resistance shifts in unanesthetized cats. Exp. Neurol. 1968;22:243–52. doi: 10.1016/0014-4886(68)90054-X. - DOI - PubMed
    1. Gilad O, Ghosh A, Oh D, Holder D S. A method for recording resistance changes non-invasively during neuronal depolarization with a view to imaging brain activity with electrical impedance tomography. J. Neurosci. Methods. 2009;180:87–96. doi: 10.1016/j.jneumeth.2009.03.012. - DOI - PMC - PubMed

Publication types

LinkOut - more resources