. 2015 Jun;145(6):489-511.
doi: 10.1085/jgp.201411281.

Ryanodine receptor gating controls generation of diastolic calcium waves in cardiac myocytes

Affiliations

Ryanodine receptor gating controls generation of diastolic calcium waves in cardiac myocytes

Pavol Petrovič et al. J Gen Physiol. 2015 Jun.

Abstract

The role of cardiac ryanodine receptor (RyR) gating in the initiation and propagation of calcium waves was investigated using a mathematical model comprising a stochastic description of RyR gating and a deterministic description of calcium diffusion and sequestration. We used a one-dimensional array of equidistantly spaced RyR clusters, representing the confocal scanning line, to simulate the formation of calcium sparks. Our model provided an excellent description of the calcium dependence of the frequency of diastolic calcium sparks and of the increased tendency for the production of calcium waves after a decrease in cytosolic calcium buffering. We developed a hypothesis relating changes in the propensity to form calcium waves to changes of RyR gating and tested it by simulation. With a realistic RyR gating model, increased ability of RyR to be activated by Ca2+ strongly increased the propensity for generation of calcium waves at low (0.05-0.1-µM) calcium concentrations but only slightly at high (0.2-0.4-µM) calcium concentrations. Changes in RyR gating altered calcium wave formation by changing the calcium sensitivity of spontaneous calcium spark activation and/or the average number of open RyRs in spontaneous calcium sparks. Gating changes that did not affect RyR activation by Ca2+ had only a weak effect on the propensity to form calcium waves, even if they strongly increased calcium spark frequency. Calcium waves induced by modulating the properties of the RyR activation site could be suppressed by inhibiting the spontaneous opening of the RyR. These data can explain the increased tendency for production of calcium waves under conditions when RyR gating is altered in cardiac diseases.


Figures

Figure 1.
Figure 1.
Calcium sparks at different cytosolic [Ca2+]. (A) Typical examples of simulated calcium sparks at the indicated cytosolic [Ca2+]. (B) Calcium dependence of spark frequency. Black squares, experimental data (Lukyanenko and Gyorke, 1999), assuming 36.4 release sites per 100-µm line scan (Zahradníková et al., 2010; Janíček et al., 2012). Line, theoretical calcium dependence of spontaneous calcium spark frequency calculated from Eq. 2 using parameters from Tables 1 and 2. Red circles, simulated data (error bars are smaller than the size of the symbols). Error bars represent mean ± SEM.
Figure 2.
Figure 2.
The effect of simulated EGTA removal on propagation of calcium waves. (A) Simulated calcium sparks at 0.05 µM of cytosolic [Ca2+] and at different values of the parameter n, used for simulating changes of EGTA concentration (see section Spontaneous diastolic calcium waves simulated using the aHTG model of the RyR). (B) The calcium dependence of the frequency of triggered sparks (ΔϕSpark) in control and for n = 2 and n = 3 (black, red, and blue symbols, respectively). (C) The calcium dependence of the average number of open RyRs in spontaneous (open symbols) and triggered sparks (closed symbols) in control (n = 1) and for n = 2 and n = 3 (black, red, and blue symbols, respectively). Error bars represent mean ± SEM.
Figure 3.
Figure 3.
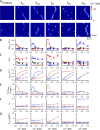
Simulation of calcium sparks with different activation site–related parameters of the RyR gating model. (A) Typical simulations for cytosolic [Ca2+] of 0.05 (top row) and 0.4 µM (bottom row) for (left to right) control, a threefold decrease of KCa, a threefold increase of KMg, a threefold decrease of fCa and fMg, and a twofold increase of pdis. (B–G) The calcium dependence of the frequency of triggered sparks (ΔϕSpark; B), the increase of the average number of open RyRs in triggered sparks (ΔnO; C), spontaneous spark frequency (ϕSpark; D), calcium sensitivity of spontaneous spark frequency (CaϕSpark; E), average number of open RyRs in spontaneous sparks (nO; F), and calcium sensitivity of the average number of open RyRs in spontaneous sparks (CanO; G) for control conditions (black symbols) and for decreased (red symbols) and increased (blue symbols) parameters KCa, KMg, fCa, pdis, and fMg. The parameters were changed to 33 and 300% of control, except for pdis that was changed to 50 and 200% of control. Theoretical predictions (D–G) and predictions of multiple linear regression (B and C) are shown by solid lines. Theoretical values and data from simulations at calcium concentrations used in the experiment (Lukyanenko and Gyorke, 1999) shown in Fig. 1 are shown as open and closed symbols, respectively. Error bars represent mean ± SEM.
Figure 4.
Figure 4.
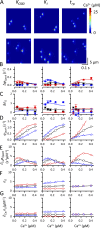
Simulation of calcium sparks with different parameters of the RyR and CRU models not related to the RyR activation site. (A) Typical simulations for cytosolic [Ca2+] of 0.05 (top row) and 0.4 µM (bottom row) for (left to right) a threefold decrease of KO00, a threefold increase of KI, and a threefold decrease of trp. (B–G) The calcium dependence of the frequency of triggered sparks (ΔϕSpark; B), the increase of the average number of open RyRs in triggered sparks (ΔnO; C), spontaneous spark frequency (ϕSpark; D), calcium sensitivity of spontaneous spark frequency (CaϕSpark; E), average number of open RyRs in spontaneous sparks (nO; F), and calcium sensitivity of the average number of open RyRs in spontaneous sparks (CanO; G) for control conditions (black symbols) and for decreased (red symbols) and increased (blue symbols) parameters KO00, KI, and trp. The parameters were changed to 33 and 300% of control. Theoretical predictions (D–G) and predictions of multiple linear regression (B and C) are shown by solid lines. Theoretical values and data from simulations at calcium concentrations used in the experiment (Lukyanenko and Gyorke, 1999) shown in Fig. 1 are shown as open and closed symbols, respectively. Error bars represent mean ± SEM.
Figure 5.
Figure 5.
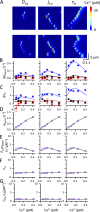
Simulation of calcium sparks with different calcium handling–related parameters. (A) Typical simulations for cytosolic [Ca2+] of 0.05 (top row) and 0.4 µM (bottom row) for (left to right) a threefold increase of DCa, jCa, and τd. (B–G) The calcium dependence of the frequency of triggered sparks (ΔϕSpark; B), the increase of the average number of open RyRs in triggered sparks (ΔnO; C), spontaneous spark frequency (ϕSpark; D), calcium sensitivity of spontaneous spark frequency (CaϕSpark; E), average number of open RyRs in spontaneous sparks (nO; F), and calcium sensitivity of the average number of open RyRs in spontaneous sparks (CanO; G) for control conditions (black symbols) and for decreased (red symbols) and increased (blue symbols) parameters DCa, jCa, and τd. The parameters were changed to 33 and 300% of control. Theoretical predictions (D–G) and predictions of multiple linear regression (B and C) are shown by solid lines. Theoretical values and data from simulations at calcium concentrations used in the experiment (Lukyanenko and Gyorke, 1999) shown in Fig. 1 are shown as open and closed symbols, respectively. Error bars represent mean ± SEM.
Figure 6.
Figure 6.
The effect of the properties of spontaneous sparks on the predicted properties of triggered sparks in control and under conditions when changes in RyR gating increase the propensity to form calcium waves. (A) The relative effect of ∂Caϕspark (red dashed line) and nO (blue dashed line) on the frequency of triggered sparks (black solid line). (B) The relative effect of ∂Caϕspark (red dashed line), nO (blue dashed line), and CanO (magenta dashed line) on the increase of the number of open RyRs in triggered sparks (black solid line). Individual changes of simulation parameters are denoted at the top of the figure.
Figure 7.
Figure 7.
The contribution of calcium-handling properties to the properties of triggered sparks in control, under conditions when the propensity to form calcium waves is increased by changes in RyR gating, and upon changes in DCa, jCa, and τd. (A) The relative effect of DCa (red dashed line), jCa (green dashed line), and τd (blue dashed line) on the frequency of triggered sparks (black solid line). (B) The relative effect of DCa (red dashed line), jCa (green dashed line), τd (blue dashed line), and CanO (magenta dashed line) on the increase of the number of open RyRs in triggered sparks (black solid line). Individual changes of simulation parameters are denoted at the top of the figure.
Figure 8.
Figure 8.
Analysis of calcium waves. (A) The relationship between the frequency of triggered sparks and the length of wave events. Best overall linear fit (RP = 0.91) is shown as a solid black line. Black, red, green, and blue symbols correspond to parameter groups LA, RyR-Act, RyR, and CaH, respectively (see section Quantitative relationships characterizing the propensity to form calcium waves for explanation of groups), and the corresponding dashed lines show the best linear fits for individual groups. (B) The calcium dependence of the fraction of waves terminated by propagation failure (red), by collision of two waves (black), or by refractoriness (blue). Linear fits of the calcium dependence are shown by lines. (C–E) The fraction of calcium waves terminated by propagation failure (C), by wave collision (D), and by refractoriness (E) for different groups of model parameter changes (see text for explanation of groups). Significant differences between groups are shown by horizontal black lines (two-way ANOVA with Bonferroni correction; P < 0.05). Error bars represent mean ± SEM.
Figure 9.
Figure 9.
Suppression of calcium waves by modulation of the spontaneous opening transition of the RyR. (A–C) Typical simulations of calcium release events at cytosolic [Ca2+] of 0.05 µM in control (A), after a threefold decrease of fCa (B), and when a threefold decrease of fCa was combined with a threefold increase of KO00 (C). (D) Frequency of triggered sparks at [Ca2+] of 0.05 µM under control conditions and when the indicated RyR gating parameters were changed in the direction supporting wave formation (33% fCa, 33% KCa, 300% KMg, and 200% pdis). Gray columns indicate results of simulation with a control value of KO00, whereas the results for KO00 increased to 300% of control are shown as black columns. Significant differences between groups are shown by horizontal black lines (one-way ANOVA with Bonferroni correction; P < 0.05). Error bars represent mean ± SEM.

Similar articles

Cited by

References

    1. Allbritton N.L., Meyer T., and Stryer L.. 1992. Range of messenger action of calcium ion and inositol 1,4,5-trisphosphate. Science. 258:1812–1815. 10.1126/science.1465619 - DOI - PubMed
    1. Ashley R.H., and Williams A.J.. 1990. Divalent cation activation and inhibition of single calcium release channels from sheep cardiac sarcoplasmic reticulum. J. Gen. Physiol. 95:981–1005. 10.1085/jgp.95.5.981 - DOI - PMC - PubMed
    1. Baddeley D., Jayasinghe I.D., Lam L., Rossberger S., Cannell M.B., and Soeller C.. 2009. Optical single-channel resolution imaging of the ryanodine receptor distribution in rat cardiac myocytes. Proc. Natl. Acad. Sci. USA. 106:22275–22280. 10.1073/pnas.0908971106 - DOI - PMC - PubMed
    1. Bai Y., Jones P.P., Guo J., Zhong X., Clark R.B., Zhou Q., Wang R., Vallmitjana A., Benitez R., Hove-Madsen L., et al. . 2013. Phospholamban knockout breaks arrhythmogenic Ca2+ waves and suppresses catecholaminergic polymorphic ventricular tachycardia in mice. Circ. Res. 113:517–526. 10.1161/CIRCRESAHA.113.301678 - DOI - PMC - PubMed
    1. Baylor S.M., and Hollingworth S.. 1998. Model of sarcomeric Ca2+ movements, including ATP Ca2+ binding and diffusion, during activation of frog skeletal muscle. J. Gen. Physiol. 112:297–316. 10.1085/jgp.112.3.297 - DOI - PMC - PubMed

Publication types

Substances