

Review
doi: 10.1085/jgp.201411332.
The Hill analysis and co-ion-driven transporter kinetics
Affiliations
- PMID: 26009547
- PMCID: PMC4442790
- DOI: 10.1085/jgp.201411332
Item in Clipboard
Review
The Hill analysis and co-ion-driven transporter kinetics
J Gen Physiol.
2015 Jun.
Abstract
Interaction of multiple ligands with a protein or protein complex is a widespread phenomenon that allows for cooperativity. Here, we review the use of the Hill equation, which is commonly used to analyze binding or kinetic data, to analyze the kinetics of ion-coupled transporters and show how the mechanism of transport affects the Hill coefficient. Importantly, the Hill analysis of ion-coupled transporters can provide the exact number of transported co-ions, regardless of the extent of the cooperativity in ion binding.
© 2015 Lolkema and Slotboom.
Figures

Models for multiple ligand binding to biological systems. (A) Tetrameric complex. Each subunit binds ligand L. (B) Tetrameric enzyme. Each subunit catalyzes the conversion (dashed arrows) of ligand L. (C) Tetrameric ligand-gated channel. The channel opens when all subunits have bound ligand L. The dashed arrow indicates the ion flow through the open channel. (D) Ion-coupled transporter. Substrate S is translocated in symport with three co-ions H.

Mechanistic models of ligand binding. (A and B) The binding and response models. Binding schemes of ligand L to a biological unit E containing two ligand-binding sites a and b (N = 2). The dissociation constant KD refers to the binding to either of the two free sites, whereas KD* refers to binding to one site with the other site occupied. Red states contribute to the measured output. (C) The ordered-binding transporter mechanism. Substrate S and two co-ions H bind to a transporter E (N = 2). KDH* equals αKDH in which α is the interaction parameter.

Hill analysis of the saturation curve in the binding model (A), the response model (B), and an ion-coupled transporter catalyzing an ordered-binding mechanism (C). Saturation levels were calculated using Eqs. 8 and 9 for A and B, respectively, for three values of the interaction parameter α: 1 (△), 0.1 (○), and 0.01 (□). For plot C, saturation levels were calculated using Eq. 21 for two values of the interaction parameter α: 1 (triangles) and 0.01 (circles), and three values of the substrate concentration relative to KDS: 1 (light gray), 10 (dark gray), and 100 (black). The Hill analyses of the saturation curves are presented in supplemental text 3. In all cases, half saturation is observed at the x-axis intercept.

Relation between the Hill coefficient n and the mechanistic interaction parameter α. The Hill coefficient n was determined graphically at different values of interaction parameter α in the binding model (A; ○) and the response model (A; ●) and for the ordered-binding transporter mechanism with the substrate concentration poised at KDS (B; ▲), 10*KDS (B; ■), and 100*KDS (B; ●). Data points close to the x-axis intercept of the Hill plots (Fig. 3) were fitted to a straight line by least-square fits. The slope of the best fit was taken as the Hill coefficient.
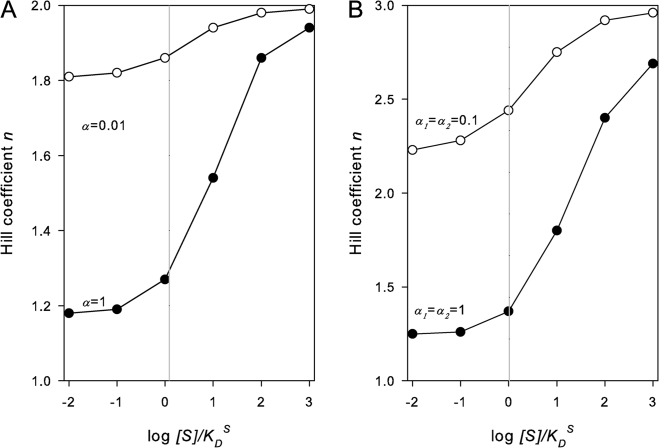
Dependence of the Hill coefficient on the substrate concentration in the ordered-binding mechanism of a transporter with two co-ion–binding sites (N = 2) and α = 1 (●) and α = 0.01 (○; A) and with three co-ion–binding sites (N = 3) and α1 = α2 = 1 (●) and α1 = α2 = 0.1 (○; B). The Hill coefficients were determined as described in the legend to Fig. 4.

Analysis of the apparent affinity for the substrate in the ordered-binding mechanism. The plot shows numerical simulations of Eq. 4.13 in supplemental text 4 for three values of the interaction parameter α: 1 (■), 0.1 (●), and 0.01 (▲). The function was rewritten to in which x is the co-ion concentration relative to the affinity constant (x = [H]/KDH).
References
-
- Bezanilla F. 2000. The voltage sensor in voltage-dependent ion channels. Physiol. Rev. 80:555–592. - PubMed
Publication types
MeSH terms
Substances
Grants and funding
LinkOut - more resources
Full Text Sources
Other Literature Sources
