Influence of Connexin40 on the renal myogenic response in murine afferent arterioles
- PMID: 26009638
- PMCID: PMC4463840
- DOI: 10.14814/phy2.12416
Influence of Connexin40 on the renal myogenic response in murine afferent arterioles
Abstract
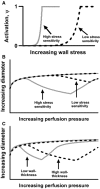
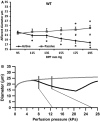
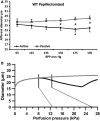
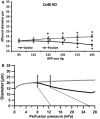
Renal autoregulation consists of two main mechanisms; the myogenic response and the tubuloglomerular feedback mechanism (TGF). Increases in renal perfusion pressure activate both mechanisms causing a reduction in diameter of the afferent arteriole (AA) resulting in stabilization of the glomerular pressure. It has previously been shown that connexin-40 (Cx40) is essential in the renal autoregulation and mediates the TGF mechanism. The aim of this study was to characterize the myogenic properties of the AA in wild-type and connexin-40 knockout (Cx40KO) mice using both in situ diameter measurements and modeling. We hypothesized that absence of Cx40 would not per se affect myogenic properties as Cx40 is expressed primarily in the endothelium and as the myogenic response is known to be present also in isolated, endothelium-denuded vessels. Methods used were the isolated perfused juxtamedullary nephron preparation to allow diameter measurements of the AA. A simple mathematical model of the myogenic response based on experimental parameters was implemented. Our findings show that the myogenic response is completely preserved in the AA of the Cx40KO and if anything, the stress sensitivity of the smooth muscle cell in the vascular wall is increased rather than reduced as compared to the WT. These findings are compatible with the view of the myogenic response being primarily a local response to the local transmural pressure.
Keywords: Afferent arteriole; autoregulation; connexin; myogenic.
© 2015 The Authors. Physiological Reports published by Wiley Periodicals, Inc. on behalf of the American Physiological Society and The Physiological Society.
Figures


Similar articles
-
Role of connexin40 in the autoregulatory response of the afferent arteriole.Am J Physiol Renal Physiol. 2012 Sep 15;303(6):F855-63. doi: 10.1152/ajprenal.00026.2012. Epub 2012 Jul 18. Am J Physiol Renal Physiol. 2012. PMID: 22811484
-
Analysis of interaction between TGF and the myogenic response in renal blood flow autoregulation.Am J Physiol. 1995 Oct;269(4 Pt 2):F581-93. doi: 10.1152/ajprenal.1995.269.4.F581. Am J Physiol. 1995. PMID: 7485545
-
Influence of connexin45 on renal autoregulation.Am J Physiol Renal Physiol. 2020 Mar 1;318(3):F732-F740. doi: 10.1152/ajprenal.00185.2019. Epub 2020 Jan 27. Am J Physiol Renal Physiol. 2020. PMID: 31984796
-
Systolic pressure and the myogenic response of the renal afferent arteriole.Acta Physiol Scand. 2004 Aug;181(4):407-13. doi: 10.1111/j.1365-201X.2004.01312.x. Acta Physiol Scand. 2004. PMID: 15283752 Review.
-
Role of the efferent arteriole in tubuloglomerular feedback.Kidney Int Suppl. 1991 Jun;32:S71-3. Kidney Int Suppl. 1991. PMID: 1881055 Review.
Cited by
-
Modeling of Kidney Hemodynamics: Probability-Based Topology of an Arterial Network.PLoS Comput Biol. 2016 Jul 22;12(7):e1004922. doi: 10.1371/journal.pcbi.1004922. eCollection 2016 Jul. PLoS Comput Biol. 2016. PMID: 27447287 Free PMC article.
-
Lack of Connexins 40 and 45 Reduces Local and Conducted Vasoconstrictor Responses in the Murine Afferent Arterioles.Front Physiol. 2020 Aug 7;11:961. doi: 10.3389/fphys.2020.00961. eCollection 2020. Front Physiol. 2020. PMID: 32848881 Free PMC article.
References
-
- Brekke JF, Gokina NI. Osol G. Vascular smooth muscle cell stress as a determinant of cerebral artery myogenic tone. Am. J. Physiol. Heart Circ. Physiol. 2002;283:H2210–H2216. - PubMed
-
- Carlson BE. Secomb TW. A theoretical model for the myogenic response based on the length-tension characteristics of vascular smooth muscle. Microcirculation. 2005;12:327–338. - PubMed
-
- Carmines PK. Inscho EW. Perfusate composition modulates in vitro renal microvascular pressure responsiveness in a segment-specific manner. Microvasc. Res. 1992;43:347–351. - PubMed
-
- Carmines PK, Inscho EW. Gensure RC. Arterial pressure effects on preglomerular microvasculature of juxtamedullary nephrons. Am. J. Physiol. 1990;258:F94–F102. - PubMed
LinkOut - more resources
Full Text Sources
Other Literature Sources
Molecular Biology Databases

