. 2015 Aug;33(8):2483-95.
doi: 10.1002/stem.2052. Epub 2015 May 27.

IGF1 Promotes Adipogenesis by a Lineage Bias of Endogenous Adipose Stem/Progenitor Cells

Affiliations

IGF1 Promotes Adipogenesis by a Lineage Bias of Endogenous Adipose Stem/Progenitor Cells

Li Hu et al. Stem Cells. 2015 Aug.

Abstract

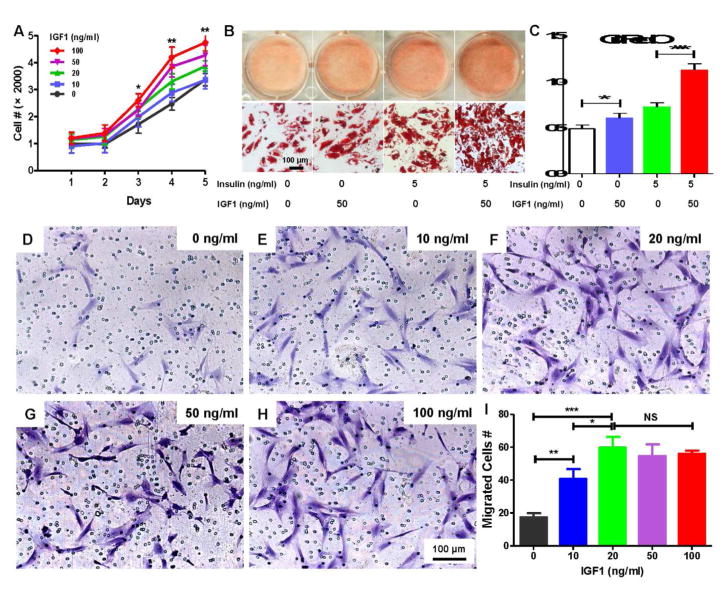
Adipogenesis is essential for soft tissue reconstruction following trauma or tumor resection. We demonstrate that CD31(-)/34(+)/146(-) cells, a subpopulation of the stromal vascular fraction (SVF) of human adipose tissue, were robustly adipogenic. Insulin growth factor-1 (IGF1) promoted a lineage bias towards CD31(-)/34(+)/146(-) cells at the expense of CD31(-)/34(+)/146(+) cells. IGF1 was microencapsulated in poly(lactic-co-glycolic acid) scaffolds and implanted in the inguinal fat pad of C57Bl6 mice. Control-released IGF1 induced remarkable adipogenesis in vivo by recruiting endogenous cells. In comparison with the CD31(-)/34(+)/146(+) cells, CD31(-)/34(+)/146(-) cells had a weaker Wnt/β-catenin signal. IGF1 attenuated Wnt/β-catenin signaling by activating Axin2/PPARγ pathways in SVF cells, suggesting IGF1 promotes CD31(-)/34(+)/146(-) bias through tuning Wnt signal. PPARγ response element (PPRE) in Axin2 promoter was crucial for Axin2 upregulation, suggesting that PPARγ transcriptionally activates Axin2. Together, these findings illustrate an Axin2/PPARγ axis in adipogenesis that is particularly attributable to a lineage bias towards CD31(-)/34(+)/146(-) cells, with implications in adipose regeneration.

Keywords: Adipose; Axin2; CD146; Insulin growth factor-1; Mesenchymal; PPARγ; Stem cells; Stromal vascular fraction.


Figures

Figure 1
Figure 1. Immunolocalization of CD31-/34+/146+/− cells in lipectomized human adipose tissue and adipogenic fractions
Sections of human adipose tissue (anonymous female, 52-yrs-old) were stained with anti-CD34 (A), anti-CD146 (B, F) and counterstained with DAPI (C, G). Merged image shows that CD146+ cells were primarily, but not exclusively, associated with blood vessels (D). CD31 (E) was virtually exclusively associated with blood vessels. Again, not all CD146+ cells were associated with blood vessels in the merged image (H) (a–d, scale bar, 200 μm; e–h, scale bar, 50 μm). (I) Flow cytometry showed that ~94.5% cells in the first passage of the stromal vascular fraction (SVF p1) of this lipectomized human adipose tissue were CD31-/34+, among which ~20.7% were CD146−, and ~59.5% were CD146+. By the third passage (SVF p3) (J), CD31-/34+ cells dropped drastically from ~94.5% to 9.6%. There was a lineage reduction of CD146− cells from ~20.7% to ~11.2% with a concomitant gain of 146+ cells (from ~59.2% to ~71.2%) (mean ± s.d., n=3). Adipogenesis occurred when SVF cells (K), CD31-/34− cells (L) and CD31-/34+/146+/− cells (M, N) were exposed to adipogenic medium. Strikingly, CD31-/34+/146− cells showed remarkable adipogenesis ability (N) with corresponding quantitative data of PPARγ and FABP4 expression (O) (mean ± s.d., n=3, **p<0.01, ANOVA); (scale bar, 200 μm for K–N). Ki67 showed rapid proliferation of CD31-/34+/146+ cells (P), relative to CD31-/34+/146− cells (Q) (scale bar, 50 μm) with quantitative data of Ki67 positive cells percentage (R). Osteogenic potential (Alizarin red) of SVF cells (S), CD31-/34− cells (T), CD31-/34+/146+ cells (U) and CD31-/34+/146− cells (V).
Figure 2
Figure 2. Contrasting Wnt and PPARγ signaling in CD31-CD34+CD146− and CD31-CD34+CD146+ cells
β-catenin staining was modest in CD31-/34+/146− cells (A, B, C and insert). CD31-CD34+CD146+ cells showed robust nuclear β-catenin staining (D, E, F and insert) (scale bar, 100 μm). Nuclei β-catenin positive cells were quantitatively detected (G) (mean ± s.d., n=3, *p<0.05, Student’s t-test), and β-catenin protein level was pronounced in CD31-/34+/146+ cells, relative to CD31-/34+CD146− cells (H). Wnt Topflash activity and cyclin D1 were significantly higher in CD31-/34+/146+ cells than CD31-/34+/146− cells (I) (mean ± s.d., n=3, **p<0.01, ***p<0.001, ANOVA). PPARγ was significantly attenuated after CD31-/34+ cells, regardless of CD146 polarity, were exposed to with 10 ng/mL Wnt3a in adipogenesis medium (J). Conversely, PPARγ overexpression in CD31-/34+ cells, regardless of CD146 polarity, was associated with attenuated Wnt topflash activity (K) (mean ± s.d., n=3, **p<0.01, ***p<0.001, ANOVA).
Figure 3
Figure 3. IGF1 enriches CD31-CD34+CD146− subpopulation
The third passage of stromal vascular fraction of human adipose stem/progenitor cells was subjected to flow cytometry (A). With 10 ng/mL IGF1, CD31-/34+CD146− cells increased from ~10.8% to ~19.9%, whereas CD31-/34+/146+ cells decreased from ~71.02% to ~57.5% (A, B). IGF1 stimulated a lineage bias of CD31-/34+ subpopulation towards CD146− cells (C, D). The lineage switch towards CD146− cells did not affect the totality of CD31-/34+ cells (E) (mean ± s.d., n=3; ANOVA). CD31-/34+/146+ cells showed significantly higher proliferation rates than donor-matched CD31-/34+/146− cells (F). IGF1 further increased the proliferation rates of CD31-/34+ cells, regardless of CD146 polarity, by maintaining the same trend with significantly greater proliferation rates of CD31-/34+/146+ cells (F) (mean ± s.d., n=3, **p<0.01, ***p<0.001, ANOVA).
Figure 4
Figure 4. IGF1 promotes proliferation, adipogenic differentiation and migration
IGF1 (0–100 ng/mL) promoted the proliferation of stromal vascular fraction (SVF) cells from lipectomized human adipose tissue in a dose dependent manner (A) (mean ± s.d., n=3, *p<0.05, **p<0.01, ANOVA). IGF1 promoted adipogenesis upon 14-day induction in chemically defined medium, prominently in the presence of insulin; Oil red O staining (B) (scale bar, 100 μm), with quantification in C, showing 50 ng/mL IGF1 induced significant adipogenesis (C) (mean ± s.d., n=3, *p<0.05, ***p<0.001, ANOVA). (D–H) Different numbers of SVF cells from lipectomized human adipose tissue migrated (Crystal violet staining) (scale bar, 100 μm), with quantified data in (I) (mean ± s.d., n=3, *p<0.05, **p<0.01, ***p<0.001, ANOVA, NS: no significance).
Figure 5
Figure 5. Control-released IGF1 induces in vivo adipogenesis
Porous poly (lactic-co-glycolic acid) (PLGA) scaffolds (5×3 mm) (A) were fabricated with pore size range of 125 to 500 μm (SEM) (B). SEM of a bisected PLGA scaffold to reveal loaded PLGA microspheres (arrows) (C). IGF1 was encapsulated in PLGA microspheres and loaded in porous PLGA scaffolds (C, scale bar, 100 μm). (D) Microencapsulated IGF1 was sustainably released in the tested 4 wks. Adipose tissue formation within a representative PLGA scaffold with IGF1 microspheres following 4-wk implantation in the inguinal fat of C57Bl6 mice showing overall dimensions maintained (5×3 mm) (E) (scale bar, 1 mm). A representative IGF1-free PLGA scaffold following 4-wk in vivo implantation showing modest tissue ingrowth (F, G). A representative IGF1 delivered scaffold showed adipogenesis and adipose stroma (J, K) (F, J, scale bar, 200 μm; G, K, scale bar, 50 μm). Adipocyte number was counted based on morphology in the slides and the relative area was determined by the percentage to scaffold area. The number of adipocytes and adipocyte area were significantly greater in IGF1 delivery scaffolds than IGF1-free scaffolds (N, O) (mean ± s.d., n=3, ***p<0.001, ANOVA). No FABP4 expression in IGF1-free scaffolds (H), and FABP4 staining in IGF1 delivery scaffolds confirmed adipose tissue formation (L) (scale bar, 50 μm). Anti-CD146 antibody staining showed the absence of CD146+ cells in IGF1-free scaffold (I) and the presence of CD146− and CD146+ cells in IGF1 delivered scaffold (M) (scale bar, 50 μm).
Figure 6
Figure 6. Axin2/PPARγ signaling activates adipogenesis
PPARγ (A) and Axin2 (B) showed significantly higher expression in CD31-/34+ cells upon IGF1 induction, regardless of CD146 polarity, but significantly attenuated TOPflash luciferase activity (C) and cyclin D1 mRNA expression (D). Native CD31-/34+/146− cells showed significantly higher Axin2 level than CD31-/34+/146+ cells (E) (mean ± s.d., n=3, *p<0.05, **p<0.01, ***p<0.001, Student’s t-test). Axin2 and PPARγ showed positive correlation in CD31-/34+ cells, regardless of CD146 polarity (F). PPARγ and/or PGC1α induced Axin2 expression by Western blot, GAPDH served as an internal control (G). Stromal vascular fraction cells over-expressed with PPARγ and/or PGC1α showed significantly higher Axin2 expression in growth medium (H) and adipogenesis medium (I). Knockdown of PPARγ and/or PGC1α (J, K, L) with corresponding siRNAs significantly attenuated Axin2 expression in SVF cells (M) (mean ± s.d., n=3, *p<0.05, **p<0.01, ***p<0.001, Student’s t-test).
Figure 7
Figure 7. PPARγ transcriptionally activates Axin2 in adipogenesis
Schematics of Axin2 promoter with ~1000 bp upstream of Axin2 translation start site (ATG) with a putative PPRE (A). ChIP analysis revealed binding of PPARγ to Axin2 PRE promoter region (B). Stromal vascular fraction cells (SVF) exposed to adipogenic differentiation medium for 4 days and then harvested for luciferase report analysis, showing that Axin2 PPRE induced Axin2 luciferase activity in the presence of PPARγ and/or PGC1α (C). Without Axin2 PPRE, Axin2 luciferase activity was attenuated even in the presence of PPARγ and/or PGC1α (D). Axin2 knockdown with shAxin2 transfection showed Axin2 absence (E) and severely attenuated (F), with shScramble served as negative control. TOPflash luciferase activity and CyclinD1 were upregulated following Axin2 knockdown (G, H). SVF cells showed adipogenesis (I) that is remarkably reduced following Axin2 knockdown (J) (scale bar, 100 μm). PPARγ increased in SVF cells undergoing adipogenesis but was attenuated by Axin2 scrambling in the tested 14 days (K) (mean ± s.d., n=3, *p<0.05, **p<0.01, ***p<0.001, ANOVA).

References

    1. Spiegelman BM, Flier JS. Adipogenesis and obesity: rounding out the big picture. Cell. 1996;87(3):377–89. - PubMed
    1. Rosen ED, Spiegelman BM. What we talk about when we talk about fat. Cell. 2014;156(1–2):20–44. - PMC - PubMed
    1. Cohen P, et al. Ablation of PRDM16 and beige adipose causes metabolic dysfunction and a subcutaneous to visceral fat switch. Cell. 2014;156(1–2):304–16. - PMC - PubMed
    1. Schmidt BA, Horsley V. Intradermal adipocytes mediate fibroblast recruitment during skin wound healing. Development. 2013;140(7):1517–27. - PMC - PubMed
    1. Astori G, et al. “In vitro” and multicolor phenotypic characterization of cell subpopulations identified in fresh human adipose tissue stromal vascular fraction and in the derived mesenchymal stem cells. J Transl Med. 2007;5:55. - PMC - PubMed

Publication types

Substances