. 2015 Oct;14(5):764-73.
doi: 10.1111/acel.12354. Epub 2015 May 25.

MARCKS-dependent mucin clearance and lipid metabolism in ependymal cells are required for maintenance of forebrain homeostasis during aging

Affiliations

MARCKS-dependent mucin clearance and lipid metabolism in ependymal cells are required for maintenance of forebrain homeostasis during aging

Nagendran Muthusamy et al. Aging Cell. 2015 Oct.

Abstract

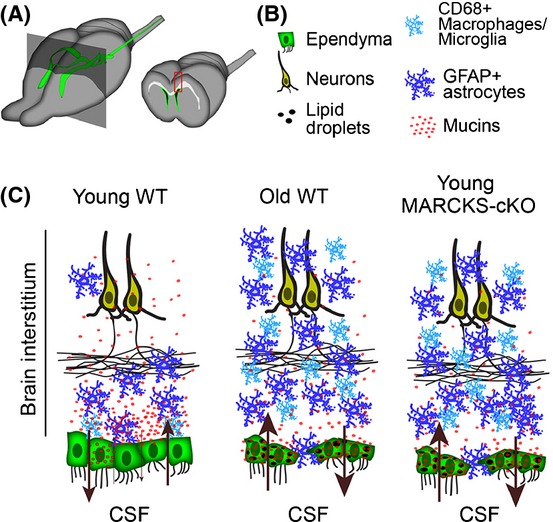
Ependymal cells (ECs) form a barrier responsible for selective movement of fluids and molecules between the cerebrospinal fluid and the central nervous system. Here, we demonstrate that metabolic and barrier functions in ECs decline significantly during aging in mice. The longevity of these functions in part requires the expression of the myristoylated alanine-rich protein kinase C substrate (MARCKS). Both the expression levels and subcellular localization of MARCKS in ECs are markedly transformed during aging. Conditional deletion of MARCKS in ECs induces intracellular accumulation of mucins, elevated oxidative stress, and lipid droplet buildup. These alterations are concomitant with precocious disruption of ependymal barrier function, which results in the elevation of reactive astrocytes, microglia, and macrophages in the interstitial brain tissue of young mutant mice. Interestingly, similar alterations are observed during normal aging in ECs and the forebrain interstitium. Our findings constitute a conceptually new paradigm in the potential role of ECs in the initiation of various conditions and diseases in the aging brain.

Keywords: Clca3; aging; barrier function; cerebral cortex; ependymal cells; lipid droplets; mucin; oxidative stress.


Figures

Fig 1
Fig 1
MARCKS is expressed in ECs and is internalized upon phosphorylation. (A) Approach utilized throughout the study in using cross sections and wholemounts from mouse brains for various analyses. (B) FOXJ1:EGFP transgenic mice with EGFP labeled ECs (green, outlined with white dotted lines) were utilized for immunofluorescence analysis of MARCKS (red), phosphorylated MARCKS (p-MARCKS, red) and atypical PKC zeta (aPKCζ, red) in young (2M) and old (2Y) brains. Nuclei are labeled with DAPI (blue); asterisks indicate the lumen of the ventricles. Note that immunoreactivity outside ECs is highly variable, which results in differences seen in these images and do not necessarily reflect effects of aging. ‘+PMA’ marks sections obtained from 2M and 2Y FOXJ1:EGFP brains which were intraventricularly injected with PMA and perfused 5 min later. MARCKS, p-MARCKS, and aPKCζ localizations were significantly altered upon PMA stimulation. Scale bars: 10 μm. (C) Diagram of approach to selectively label ECs in vivo with a FOXJ1-cre-dependent tdTomato reporter system (Fc:tdTom). (D) Adult ECs were electroporated with a MARCKS::YFP construct to analyze its dynamics in wholemounts ex vivo. (E) Low-magnification images illustrating mosaic of Fc:tdTom ECs (red) successfully electroporated with the MARCKS::YFP expression plasmid (green) in cultured wholemounts. Scale bar: 50 μm. (F) Time-lapse panels illustrate PMA-induced dissociation and internalization of MARCKS::YFP in ECs. Scale bar: 5 μm.
Fig 2
Fig 2
Clca3 expression in the forebrain is enriched in ECs, and its localization is dependent on expression of MARCKS and aging. (A) A sagittal brain section from a 2M Fc:tdTom mouse immunostained with a Clca3-specific antibody (green; tdTom+ ependyma, red; scale bar: 1 mm). Boxed area represents the zoomed image to the right showing colabeling with a doublecortin antibody (Dcx, blue) labeling subependymal progenitors and neuroblasts on the walls of the lateral ventricles (Scale bar: 50 μm). (B) High-magnification view of individual Clca3-stained (green) ependymal cells (red) following sham or PMA intraventricular injections prior to fixation five minutes later. Asterisks mark the ventricular lumen. (C) Western blots of Clca3, Actin, and Gapdh before (input) and after immunoprecipitation of MARCKS from ependymal wholemounts with (+) and without (-) PMA treatment. The difference in the number of bands in the ‘Input’ versus ‘MARCKS IP’ lanes may be due to differential posttranslational modified states of Clca3 in lysates versus when bound to MARCKS. Note that association between Clca3 and MARCKS is independent of PMA treatment. (D) High-magnification images of Fc:tdTom ECs (red) immunostained for Clca3 (green) in wholemount preparations from young (2M) and old (2Y) wild-type (WT) mice and 2M mice in which MARCKS was conditionally deleted in ECs (cKO). Scale bars: 5 μm. (E) Percentage of Clca3 +  ECs with fibrillary and punctate patterns of Clca3 distribution in 2M and 2Y WT and 2M MARCKS-cKO forebrains. Data are mean ± SEM; n = 3 animals per genotype and age; total of 300 cells per animal; *, Student’s t-test, P < 0.0001. (F) Quantification of signal intensity of Clca3 immunoreactivity in planar axis of ependymal cells. Data represent planar distribution normalized across planar length of ependymal cells away from midline (Mid) of individual cells toward their lateral (Lat) aspects. Data are mean ± SEM; n = 3 per age and genotype.
Fig 3
Fig 3
Conditional deletion of MARCKS exacerbates the natural age-associated accumulation of intracellular mucin in ECs. (A) Panels from the Allen Brain Atlas cropped to reveal the presence of mRNA (purple) for various mucin isoforms with confirmed expression in ECs (arrows) and choroid plexus (arrowheads). Expression analysis (Exp. A.) heat maps of the mRNA signal were obtained from the same resource and overlaid onto the mRNA image (Overlap). (B) Low-magnification deconvoluted images of confocal tile-scanned sagittal sections immunostained with a pan-mucin antibody (green). tdTom+ ECs are in red; scale bar: 500 μm. (C) High-magnification images of mucin stained ECs show significant increase in proportion of cells potentially retaining mucin in old WT and 2M MARCKS-cKO brains (arrows). Asterisks indicate the lumen of the ventricles. Scale bar: 10 μm. (D) Intensity indices of mucin immunoreactivity in the forebrain away from the ventricular zone (dotted concentric circles in cartoon 1-apical, 10-basal correspond to the gradient on the x-axis in chart). (E) Percentages of tdTom+ ECs colocalized with mucin immunoreactivity at various ages and in MARCKS-cKO brains. Data are mean ± SEM, n = 3 per age and genotype; *, Student’s t-test, P < 0.05.
Fig 4
Fig 4
Conditional deletion of MARCKS alters lipid and carbohydrate metabolism in ECs. (A) Oil red O-stained sagittal sections and wholemounts across various ages and genotypes. Scale bars: sagittal, 50 μm; wholemount, 10 μm. (B) Quantification of density and diameter of lipid droplets in wholemount preparations. (C) Electron microscopy of young and old WT, and cKO ECs (green). Highlighted compartment: yellow, lipid droplets; pink, acellular gaps. Arrowheads point to lysosomal debris near large lipid droplets. Scale bars: 5 μm top row, 1 μm bottom row. (D) Immunostaining for concanavalin A (ConA, green; biomarker for carbohydrate metabolism) in ECs (Fc:tdTom, red). Asterisks indicate the lumen of the ventricles. Scale bar: 10 μm. (E) Quantifications of intensity, and apico-basal distribution of ConA immunoreactive signals in young, old, and MARCKS-cKO ependyma. Data are mean ± SEM, n = 3 per age and genotype; *, Student’s t-test, P < 0.05.
Fig 5
Fig 5
Compromised ependymal barrier function in MARCKS-cKO ependyma interrupts homeostasis in interstitial compartments of the forebrain. (A) Illustration of an Ussing chamber recording setup for measuring transepithelial current and pericellular flux in ependymal wholemounts. (B) Transepithelial resistance (TER, Ω cm2) and rate of FD4 flux (mg/min) as an indicator of paracellular barrier integrity, measured from young, old, and cKO wholemounts. Data are mean ± SEM, n = 3 per age and genotype; *, Student’s t-test, P < 0.05. (C) Immunostained sections of the cerebral cortex (ventricles are evident on the bottom of each micrograph) reveal CD68+ macrophage infiltration and GFAP+ astrogliosis in young, old, and cKO brains. Red dotted lines depict areas where measurements in (D) were quantified. Scale bar: 250 μm. (D) Quantification of CD68 and GFAP immunoreactive intensity measured from three equidistant bins from the ventricular toward the pial surfaces of the cortex (see red dotted lines in C). Data are mean ± SEM, n = 3 per age and genotype; *, Student’s t-test, P < 0.05; **, P < 0.01; ***, P < 0.001.
Fig 6
Fig 6
Working model of the role for ependyma in maintenance of homeostasis in the forebrain during aging. (A) Ventricular system of the mouse forebrain (green) is lined with ECs. Coronal view through the forebrain reveals the layers of fluids and tissue in the aging brain; CSF in the ventricles (black), ECs (Green), interstitial compartments (white and gray). Constituents in red boxed area in the coronal view are depicted in (C). (B) Key for colored constituents in (C). (C) Cellular composition within interstitial compartments is disrupted in young MARCKS-cKO and old WT compared to young WT mice. Mucins appear retained in ependyma with loss of their gradient in the brain interstitium in young MARCKS-cKO and old WT brains. This is in conjunction with the accumulation of lipid droplets in ECs. Brown arrows indicate controlled and largely unleaky nature of the ependymal barrier in the young WT versus its collapse in the young MARCKS-cKO and old WT brain. Apparent precocious aging of young ependyma in response to loss of MARCKS results in astrocytic, microglia, and macrophage infiltration (blue cells) into the interstitial layers as in normal aging, indicative of possible increase in reactive astrogliosis and macrophage accumulation in the central nervous system.

Similar articles

Cited by

References

    1. Afdhal NH, Cao X, Bansil R, Hong Z, Thompson C, Brown B, Wolf D. Interaction of mucin with cholesterol enriched vesicles: role of mucin structural domains. Biomacromolecules. 2004;5:269–275. - PubMed
    1. Blackshear PJ. The MARCKS family of cellular protein kinase C substrates. J. Biol. Chem. 1993;268:1501–1504. - PubMed
    1. Bouab M, Paliouras GN, Aumont A, Forest-Berard K, Fernandes KJ. Aging of the subventricular zone neural stem cell niche: evidence for quiescence-associated changes between early and mid-adulthood. Neuroscience. 2011;173:135–149. - PubMed
    1. Capilla-Gonzalez V, Cebrian-Silla A, Guerrero-Cazares H, Garcia-Verdugo JM, Quinones-Hinojosa A. Age-related changes in astrocytic and ependymal cells of the subventricular zone. Glia. 2014;62:790–803. - PMC - PubMed
    1. Del Bigio MR. Ependymal cells: biology and pathology. Acta Neuropathol. 2010;119:55–73. - PubMed

Publication types

MeSH terms

Substances