Observational Study
. 2015 May 26;10(5):e0124844.
doi: 10.1371/journal.pone.0124844. eCollection 2015.

Metabolomic fingerprint of heart failure with preserved ejection fraction

Affiliations
Observational Study

Metabolomic fingerprint of heart failure with preserved ejection fraction

Beshay N Zordoky et al. PLoS One. .

Abstract

Background: Heart failure (HF) with preserved ejection fraction (HFpEF) is increasingly recognized as an important clinical entity. Preclinical studies have shown differences in the pathophysiology between HFpEF and HF with reduced ejection fraction (HFrEF). Therefore, we hypothesized that a systematic metabolomic analysis would reveal a novel metabolomic fingerprint of HFpEF that will help understand its pathophysiology and assist in establishing new biomarkers for its diagnosis.

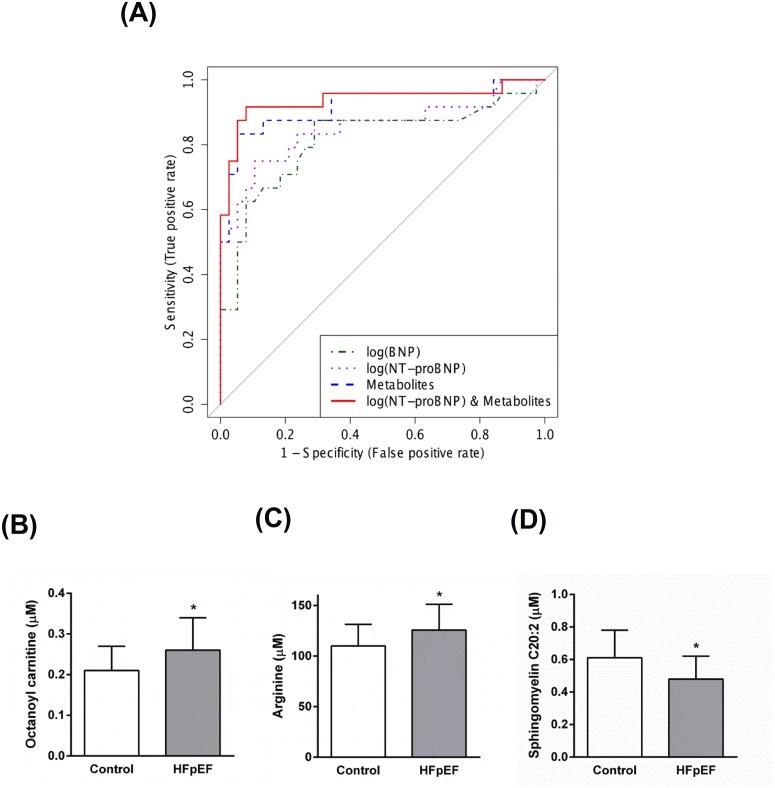
Methods and results: Ambulatory patients with clinical diagnosis of HFpEF (n = 24), HFrEF (n = 20), and age-matched non-HF controls (n = 38) were selected for metabolomic analysis as part of the Alberta HEART (Heart Failure Etiology and Analysis Research Team) project. 181 serum metabolites were quantified by LC-MS/MS and 1H-NMR spectroscopy. Compared to non-HF control, HFpEF patients demonstrated higher serum concentrations of acylcarnitines, carnitine, creatinine, betaine, and amino acids; and lower levels of phosphatidylcholines, lysophosphatidylcholines, and sphingomyelins. Medium and long-chain acylcarnitines and ketone bodies were higher in HFpEF than HFrEF patients. Using logistic regression, two panels of metabolites were identified that can separate HFpEF patients from both non-HF controls and HFrEF patients with area under the receiver operating characteristic (ROC) curves of 0.942 and 0.981, respectively.

Conclusions: The metabolomics approach employed in this study identified a unique metabolomic fingerprint of HFpEF that is distinct from that of HFrEF. This metabolomic fingerprint has been utilized to identify two novel panels of metabolites that can separate HFpEF patients from both non-HF controls and HFrEF patients.

Clinical trial registration: ClinicalTrials.gov NCT02052804.


Conflict of interest statement

Competing Interests: The authors have declared that no competing interests exist.

Figures

Fig 1
Fig 1. Flow chart representing patient selection in the metabolomics sub-study.
649 patients were enrolled in the Alberta HEART study as of March 31st, 2014. Only 82 subjects were included in this metabolomics sub-study. Among these 82 subjects, there were 24 patients with HFpEF, 20 patients with HFrEF, and 38 control subjects without heart failure.
Fig 2
Fig 2. Cardiac peptides and left ventricular ejection fraction (LVEF) in control and HF patients.
Ambulatory patients with clinical diagnosis of HFpEF (n = 24), HFrEF (n = 20), and age-matched controls (n = 38) were selected for metabolomics analysis as part of the Alberta HEART (Heart Failure Etiology and Analysis Research Team) project. Plasma BNP and NT-proBNP levels were measured using a Biosite Triage reagent pack and Elecsys 2010 proBNP assay, respectively. LVEF was assessed by echocardiography and interpreted by cardiologists blinded to the metabolomics analysis. Data are presented as the median ± IQR. * p < 0.05 compared to the control group, # p < 0.05 compared to the HFpEF group.
Fig 3
Fig 3. Heat map of metabolomic differences between HFpEF and controls.
Heat maps were generated with the concentrations of potential candidate metabolites with univariate analysis. Similar metabolites were arranged together for use in pathway analysis through intuitive pattern discovery. The heat map displays an increase in each metabolite in relative concentration as a red color and a decrease in a metabolite as a blue color. The metabolites are listed at the left side of each row, and the subjects are shown at the bottom of each column.
Fig 4
Fig 4
(A) Receiver operator characteristic (ROC) analysis for serum metabolites, cardiac peptides, and combined metabolites and NT-proBNP. Logistic regression (LR) was performed to find the most parsimonious model to discriminate HFpEF patients from control subjects using the minimum number of metabolites and/or cardiac peptides. Octanoylcarnitine, arginine, asparagine, lysophosphatidylcholine acyl C18:2, and sphingomyelin C20:2 were used in the metabolites-only panel. While octanoyl carnitine, arginine, and sphingomyelin C20:2 were used for the combined metabolites and NT-proBNP panel. (B–D) Quantification of the metabolites used to derive the LR equation of the combined metabolites and NT-proBNP model. Data are presented as means ± SD. * p < 0.05 compared to the control group.
Fig 5
Fig 5. Heat map of metabolomic differences between HFrEF and controls.
Heat maps were generated with the concentrations of potential candidate metabolites with univariate analysis. Similar metabolites were arranged together for use in pathway analysis through intuitive pattern discovery. The heat map displays an increase in each metabolite in relative concentration as a red color and a decrease in a metabolite as a blue color. The metabolites are listed at the left side of each row, and the subjects are shown at the bottom of each column.
Fig 6
Fig 6
(A) Receiver operator characteristic (ROC) analysis for serum metabolites, cardiac peptides, and combined serum metabolites and NT-proBNP. Logistic regression (LR) was performed to find the most parsimonious model to discriminate HFrEF patients from control subjects using the minimum number of metabolites and/or cardiac peptides. Creatinine, carnitine, acetoacetate, lysophosphatidylcholine acyl C18:2, 2-hydroxybutyrate, and lysophosphatidylcholine acyl C20:4 were used in the metabolites-only panel. While acetoacetate was used for the combined metabolites and NT-proBNP panel. (B) Quantification of acetoacetate which was used to derive the LR equation of the combined metabolites and NT-proBNP model. Data are presented as means ± SD. * p < 0.1 compared to the control group.
Fig 7
Fig 7. Heat map of metabolomic differences between HFpEF and HFrEF.
Heat maps were generated with the concentrations of potential candidate metabolites with univariate analysis. Similar metabolites were arranged together for use in pathway analysis through intuitive pattern discovery. The heat map displays an increase in each metabolite in relative concentration as a red color and a decrease in a metabolite as a blue color. The metabolites are listed at the left side of each row, and the subjects are shown at the bottom of each column.
Fig 8
Fig 8
(A) Receiver operator characteristic (ROC) analysis for serum metabolites, cardiac peptides, and combined serum metabolites and BNP. Logistic regression (LR) was performed to find the most parsimonious model to discriminate HFpEF from HFrEF patients using the minimum number of metabolites and/or cardiac peptides. 2-hydroxybutyrate, octadecenoylcarnitine (C18:1), hydroxyprionylcarnitine (C3-OH), and sphingomyelin C24:1 were used in the metabolites-only panel. While acetate, 2-hydroxybutyrate, pimelyl carnitine, and phosphatidyl choline diacyl C40:4 were used for the combined metabolites and NT-proBNP panel. (B–E) Quantification of the metabolites used to derive the LR equation of the combined metabolites and NT-proBNP model. Data are presented as means ± SD. The dashed line represents the metabolite concentration in control subjects. * p < 0.05 compared to the HFpEF group.

References

    1. Go AS, Mozaffarian D, Roger VL, Benjamin EJ, Berry JD, Blaha MJ, et al. Heart disease and stroke statistics—2014 update: a report from the american heart association. Circulation. 2014;129(3):e28–e292. 10.1161/01.cir.0000441139.02102.80 - DOI - PMC - PubMed
    1. Dunlay SM, Roger VL. Understanding the Epidemic of Heart Failure: Past, Present, and Future. Curr Heart Fail Rep. 2014. - PMC - PubMed
    1. Abhayaratna WP, Marwick TH, Smith WT, Becker NG. Characteristics of left ventricular diastolic dysfunction in the community: an echocardiographic survey. Heart. 2006;92(9):1259–64. - PMC - PubMed
    1. Owan TE, Hodge DO, Herges RM, Jacobsen SJ, Roger VL, Redfield MM. Trends in prevalence and outcome of heart failure with preserved ejection fraction. N Engl J Med. 2006;355(3):251–9. - PubMed
    1. Paulus WJ, Tschope C, Sanderson JE, Rusconi C, Flachskampf FA, Rademakers FE, et al. How to diagnose diastolic heart failure: a consensus statement on the diagnosis of heart failure with normal left ventricular ejection fraction by the Heart Failure and Echocardiography Associations of the European Society of Cardiology. Eur Heart J. 2007;28(20):2539–50. - PubMed

Publication types

Associated data