. 2015 Aug 15;593(16):3673-92.
doi: 10.1113/JP270471. Epub 2015 Jul 14.

Optogenetic excitation of preBötzinger complex neurons potently drives inspiratory activity in vivo

Affiliations

Optogenetic excitation of preBötzinger complex neurons potently drives inspiratory activity in vivo

Zaki Alsahafi et al. J Physiol. .

Abstract

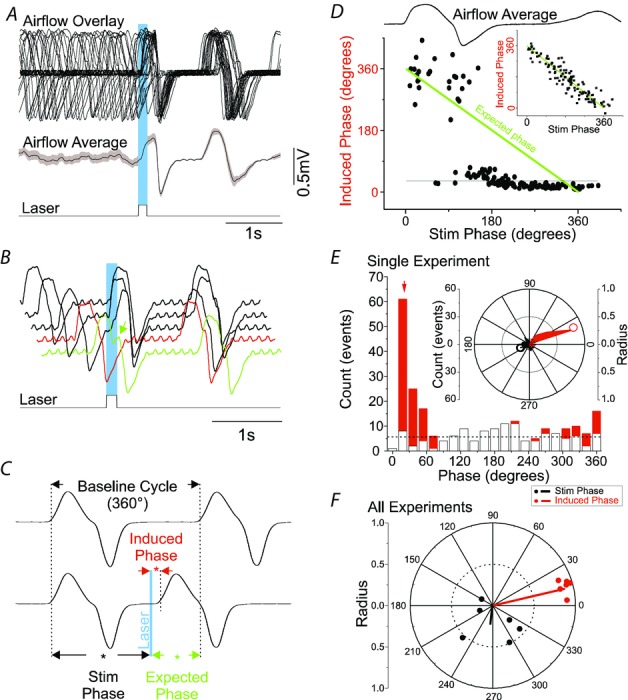
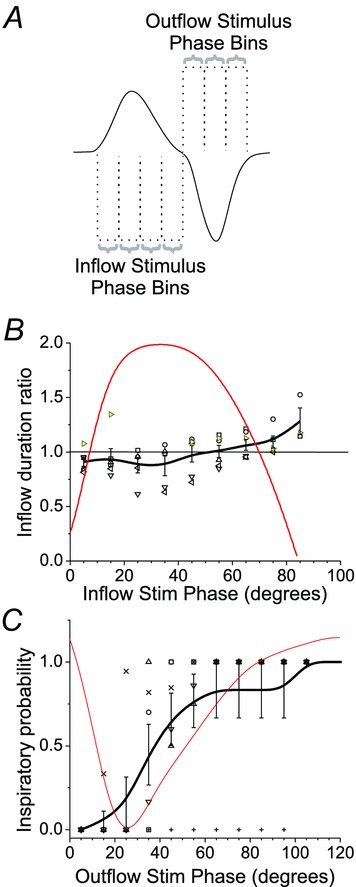
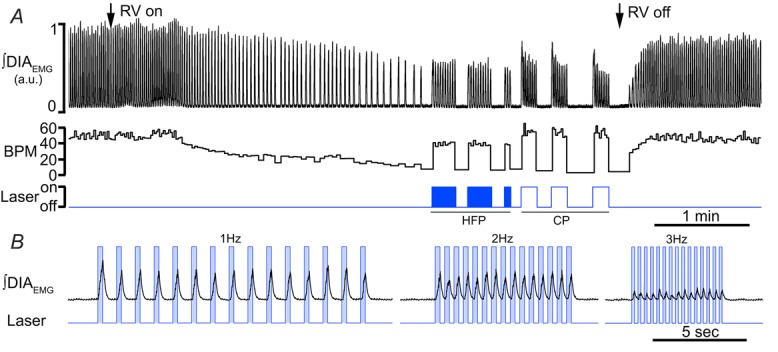
Key points: This study investigates the effects on ventilation of an excitatory stimulus delivered in a spatially and temporally precise manner to the inspiratory oscillator, the preBötzinger complex (preBötC). We used an adeno-associated virus expressing channelrhodopsin driven by the synapsin promoter to target the region of the preBötC. Unilateral optogenetic stimulation of preBötC increased respiratory rate, minute ventilation and increased inspiratory modulated genioglossus muscle activity. Unilateral optogenetic stimulation of preBötC consistently entrained respiratory rate up to 180 breaths min(-1) both in presence of ongoing respiratory activity and in absence of inspiratory activity. Unilateral optogenetic stimulation of preBötC induced a strong phase-independent Type 0 respiratory reset, with a short delay in the response of 100 ms. We identified a refractory period of ∼200 ms where unilateral preBötC optogenetic stimulation is not able to initiate the next respiratory event.

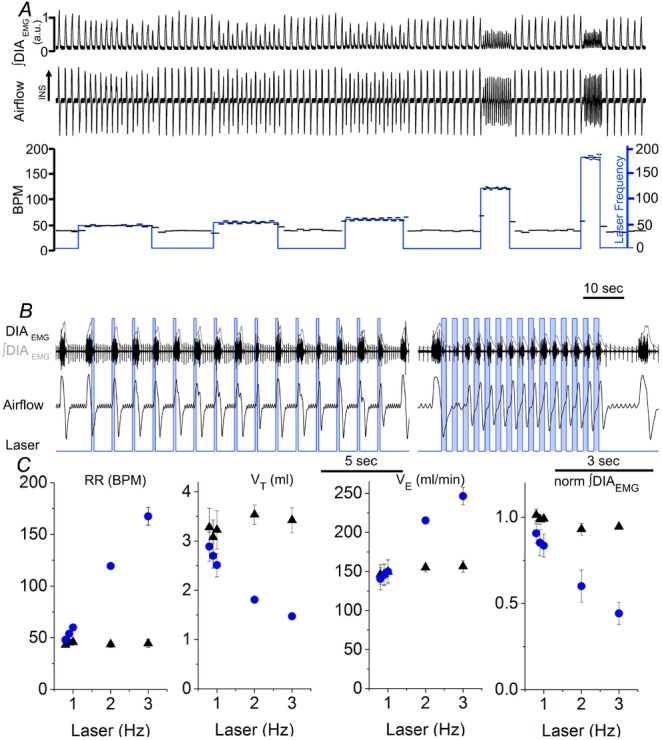
Abstract: Understanding the sites and mechanisms underlying respiratory rhythmogenesis is of fundamental interest in the field of respiratory neurophysiology. Previous studies demonstrated the necessary and sufficient role of preBötzinger complex (preBötC) in generating inspiratory rhythms in vitro and in vivo. However, the influence of timed activation of the preBötC network in vivo is as yet unknown given the experimental approaches previously used. By unilaterally infecting preBötC neurons using an adeno-associated virus expressing channelrhodopsin we photo-activated the network in order to assess how excitation delivered in a spatially and temporally precise manner to the inspiratory oscillator influences ongoing breathing rhythms and related muscular activity in urethane-anaesthetized rats. We hypothesized that if an excitatory drive is necessary for rhythmogenesis and burst initiation, photo-activation of preBötC not only will increase respiratory rate, but also entrain it over a wide range of frequencies with fast onset, and have little effect on ongoing respiratory rhythm if a stimulus is delivered during inspiration. Stimulation of preBötC neurons consistently increased respiratory rate and entrained respiration up to fourfold baseline conditions. Furthermore, brief pulses of photostimulation delivered at random phases between inspiratory events robustly and consistently induced phase-independent (Type 0) respiratory reset and recruited inspiratory muscle activity at very short delays (∼100 ms). A 200 ms refractory period following inspiration was also identified. These data provide strong evidence for a fine control of inspiratory activity in the preBötC and provide further evidence that the preBötC network constitutes the fundamental oscillator of inspiratory rhythms.


Figures

Figure 1
Figure 1. Distribution of EYFP labelled neurons along the rostrocaudal extension of the ventral respiratory column
A, three-colour confocal mosaics (left) and single-colour images (right) showing co-localization of NeuN (blue), NK1R (magenta) and EYFP (green) in transverse sections taken at the level of the preBötC (top) and BötC (bottom). Inset displays two NK1R positive neurons, one expressing EYFP and one lacking EYFP expression (asterisk). B, rostrocaudal (right–left) distribution of total NeuN+ and NeuN+/EYFP+ neurons, NK1R+ and NK1R+/EYFP+ neurons, SST+ and SST+/EYFP+ and TH+ and TH+/EYFP+ neurons after unilateral injection of SYN-ChR2-EYFP virus into the preBötC. Diagrams above plots illustrate the area (grey zone) where cell counts were performed. On the x-axis of plots the distance (in mm) from the caudal tip of the facial nucleus is indicated. Grey zone in plots indicate the area of high density of SST+ and NK1+ neurons corresponding to preBötC. Calibration bars in A: main panels, 200 μm; insets, 20 μm.
Figure 2
Figure 2. Effects of continuous (10 s) and high frequency (20 Hz, 20 ms pulse) photostimulation of preBötC in urethane-anaesthetized SYN-ChR2-EYFP-treated rats
A, long trace recording of ∫DIAEMG, ∫GGEMG, ∫ABDEMG, respiratory rate (breaths min–1, BPM) and laser activation shows that repeated photostimulation of preBötC induce reproducible and consistent increases in respiratory frequency in the presence of a continuous photostimulation (left, CP) and in presence of brief light pulses delivered at high frequency (HFP, 20 ms pulse at 20 Hz, right). Photostimulation events expanded in B are indicated with ‘i’ and ‘ii’ below the photostimulation protocol diagram. B, details of photostimulation protocols delivered in A. C, population data indicating changes in respiratory rate (RR), tidal volume (VT), minute ventilation (formula image
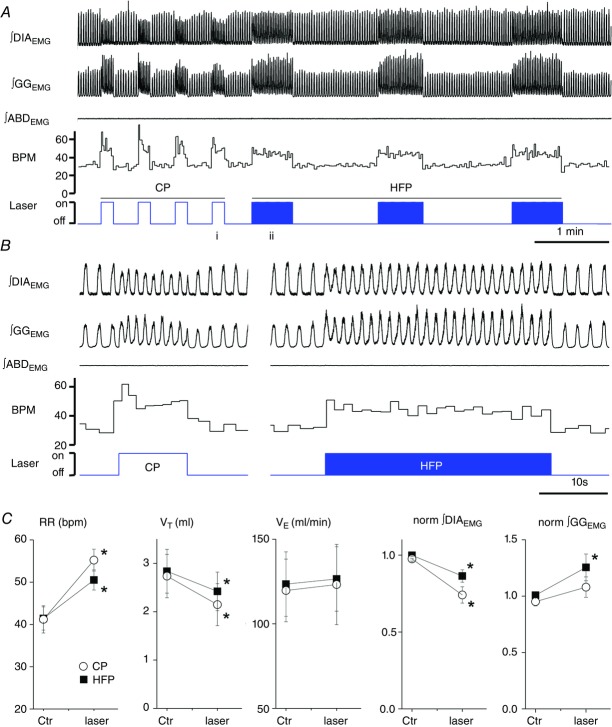
) and normalized changes in DIAEMG and GGEMG activity upon CP (circles) and HF photostimulation (squares). *Statistically significant changes (P<0.05) compared to pre-stimulation values.
Figure 3
Figure 3. Specificity of preBötC photostimulation
A, expression of cFos in SYN-ChR2-EYFP and SYN-EYFP-treated rats indicates local activation of neurons in the preBötC upon photostimulation. A1 and A2, cFos expression in the ventrolateral medulla of unilaterally SYN-ChR2-EYFP injected rat after photostimulation experiment indicates the presence of an increased number of cFos positive neurons in the photostimulated side (A1) compared to the non-stimulated side (A2). Several EYFP-expressing neurons display cfos positive nuclei (A3). Plot in A4 indicates difference in number of cFos positive cells between stimulated and unstimulated side for both SYN-ChR2-EYFP (blue squares) and SYN-EYFP (white squares) treated rats along the respiratory column. The x-axis shows (in mm) the distance from the facial nucleus. *Significant difference in cell number between stimulated and unstimulated side. B and C, two examples of the effect of photostimulation in preBötC and BötC when viral injection was misplaced and infected preferentially BötC neurons. Changes in ∫DIAEMG and respiratory frequency (BPM) upon either HFP (B) or CP (C) laser stimulation in preBötC (left) and BötC (right). Note lack of significant response when preBötC is photostimulated and strong respiratory depression when BötC is photostimulated. D, lack of response to photostimulation of preBötC when control SYN-EYFP virus is expressed in the preBötC. HFP, CP and 100 ms brief pulses at different frequencies (0.8, 0.9, 1.2 Hz) were delivered in control rats to test for ChR2-independent responses. Calibration bars in A1 and A3, 200 μm (A2 same as A1).
Figure 4
Figure 4. Reserpine pretreatment does not affect respiratory response to preBötC photostimulation
Photostimulation of preBötC in SYN-ChR2-EYFP-treated rats pretreated with reserpine display similar responses to high frequency (HFP) and continuous photostimulation (CP) (A) compared to SYN-ChR2-EYFP-treated rats. B, reserpine pretreatment does not affect the ability to entrain respiratory rhythm with brief pulses of photostimulation at progressively increasing stimulation frequencies (1 Hz, 2 Hz, 3 Hz).
Figure 5
Figure 5. Photostimulation of SYN-ChR2-EYFP-treated rats in the preBötC produces respiratory entrainment
A, long trace recordings of ∫DIAEMG, respiratory airflow, and derived instantaneous respiratory frequency (BPM scale is on left) and laser frequency (blue; stimulation frequency scale is on right, events min–1) during photostimulation at progressively higher rate (0.8, 0.9, 1, 2, 3 Hz, respectively). B, details of respiratory traces during photostimulation entrainment at 1 Hz (left) and 3 Hz (right). Boxes in B indicate the time in which laser is turned on. Note the fast recruitment of DIAEMG activity and consequent movement of respiratory flow in response to laser stimulation. C, relationship between photostimulation frequency and respiratory rate, tidal volume, minute ventilation and ∫DIAEMG in SYN-ChR2-EYFP-treated rats (circles) compared to baseline activity (triangles). Each point represents the average value (± SEM) obtained from four SYN-ChR2-EYFP-treated rat experiments. Note the limited variability of respiratory rate at multiple entrainment frequencies, reflecting successful entrainment.
Figure 6
Figure 6. Photostimulation of SYN-ChR2-EYFP-treated rats in the preBötC generates respiratory reset
A, superposition of respiratory airflow traces (top, n = 27) and average airflow trace (centre) during 150 ms pulse photostimulation (bottom), which resets and aligns the subsequent inspiratory event. The greyed area behind the dotted line on average airflow trace indicates the standard error of the mean. B, overlay of five respiratory airflow traces from the same experiment in A arranged by the phase of stimulus delivered during ongoing respiration. The red trace indicates a lack of immediate response to photostimulation when it occurs during the post-inspiratory phase (refractory period). The green trace shows a slight prolongation of inspiration (green arrow) when the stimulus is delivered during the inspiratory phase. C, calculation of phase perturbations by laser photostimulation. Top trace: baseline respiratory flow cycle (from 0 to 360 deg, measured from the onset of one inspiration to the next, see arrows). Bottom trace: respiratory flow cycle during stimulation. Stimulus phase: onset of photostimulation with respect to the phase of respiration (black asterisk and arrows); induced phase: onset of inspiration subsequent to delivery of photostimulation (red asterisk and arrows); expected phase: expected onset of the next inspiratory cycle with respect to stimulus onset if photostimulation had no effect (360 deg minus stimulus phase; green asterisk and arrows). D, average respiratory flow (top) and distribution of induced phases as a function of stimulus phase (bottom). The expected phase is shown as a green line which assumes that the subsequent phase in the absence of stimulation will occur at 360 deg from the onset of respiration (see inset for non-stimulated case). Horizontal line indicates the average induced phase for the major short latency cluster (at 30 deg) occurring for stimulus phases beyond ∼90 deg. Note, however, another prominent cluster at longer induced latencies at ∼330 deg that occurred for stimulus phases shorter than ∼90 deg. E, distribution of events for stimulus and induced phases during multiple trials of 125 ms photostimulation delivered during the same experiment as shown in A. While stimuli were distributed in a near-uniform fashion randomly across all phases of respiration (open bars), the stimulus-induced phase values (red bars) demonstrated clustering at a tight range of preferred phase angles. The red arrow indicates the average angle for the distribution of induced phases (21 deg). The horizontal dotted line indicates the expected value of both distributions across phases based on an average random assignment. These data are also plotted in polar form in the inset with stimulus phase as a black fill and induced phase as a red fill. Left scale bar indicates radial distance for number of events (0–60) for both stimulus and induced phase with divisions indicated by concentric circles on the plot itself. Innermost concentric circle represents the average expected value of the distribution similarly to the histogram representation. The average preferred angle and radius for both the stimulus and the induced phase is overlaid as an open dot (black and red, respectively). Right scale bar indicates normalized radial length for this average vector (0–1 with divisions again indicated by concentric circles on plot). Radial values close to 1 (represented by external circle) are indicative of low dispersion of angles and significant phase preferences in polar distributions. Note the marked difference of average radii between stimulus and induced phases. F, distribution of preferred phases of stimulus-induced respiration for six separate experiments at the same stimulus duration (vector end-points plotted as dots) and the calculated grand average vectors (plotted as lines) across all experiments (stimulus phase in black, induced phase in red). Note the tight similarity of clustering in induced (but not stimulus) phase angles across experiments.
Figure 7
Figure 7. A refractory period to inspiratory reset exists during early expiration
A, effect of laser photostimulation during active airflow. Inflow and outflow measures were collected for stimuli occurring in specific phase bins as illustrated. B, inspiratory duration is unaffected by stimulation during inspiratory flow. Across individual experiments, the duration of inflow during stimulation was calculated and expressed as a ratio of the baseline inflow duration based on the phase of stimulus delivery. Red line shows the actual average airflow trace occurring as a function of phase. Grey-scale symbols indicate results for individual experiments and black line is an average of values calculated in binned increments of 10 deg from onset of inspiration across the 6 experiments. Note a tendency for inflow duration to increase as stimuli were delivered at later phases of inspiratory inflow. C, refractory period for photostimulation-induced inspiration occurring during early expiration. Across experiments, the probability of successfully eliciting inspiration (i.e. the number of successful trials over the total number of trials) as a function of stimulus phase was calculated and plotted. Red trace shows the actual average airflow trace occurring as a function of phase. Grey-scale symbols indicate results for individual experiments and black line is an average of values calculated in binned increments of 10 deg from onset of inspiration across the 6 experiments. At the initial phase of expiratory flow, there is a marked limited success of photostimulation to evoke inspiration which gradually improves at later phases.
Figure 8
Figure 8. Photostimulation of SYN-ChR2-EYFP-treated rats in the preBötC restores respiratory rhythms and produces respiratory entrainment in absence of ongoing respiration
A, long trace recordings of ∫DIAEMG, and derived respiratory frequency (breaths min–1, BPM) during photostimulation at either high frequency stimulation (20 ms pulse at 20 Hz, HFP) and continuous photostimulation (10 s, CP). Note the ability of the rat to reach high level of respiratory rate upon HFP and CP. Arrows indicate the time at which rat was connected (left) and disconnected (right) with a respiratory ventilator (RV) to reach the apnoeic threshold and reinstate spontaneous breathing. B, details of respiratory traces during photostimulation entrainment at 1 Hz (left), 2 Hz (centre) and 3 Hz (right) in absence of spontaneous breathing. Boxes in B indicate the time in which laser is turned on. Note the immediate recruitment of DIAEMG upon laser onset.

Similar articles

Cited by

References

    1. Abbott SB, Coates MB, Stornetta RL, Guyenet PG. Optogenetic stimulation of c1 and retrotrapezoid nucleus neurons causes sleep state-dependent cardiorespiratory stimulation and arousal in rats. Hypertension. 2013;61:835–841. - PMC - PubMed
    1. Abbott SB, DePuy SD, Nguyen T, Coates MB, Stornetta RL, Guyenet PG. Selective optogenetic activation of rostral ventrolateral medullary catecholaminergic neurons produces cardiorespiratory stimulation in conscious mice. J Neurosci. 2013b;33:3164–3177. - PMC - PubMed
    1. Abbott SB, Kanbar R, Bochorishvili G, Coates MB, Stornetta RL, Guyenet PG. C1 neurons excite locus coeruleus and A5 noradrenergic neurons along with sympathetic outflow in rats. J Physiol. 2012;590:2897–2915. - PMC - PubMed
    1. Abbott SB, Stornetta RL, Coates MB, Guyenet PG. Phox2b-expressing neurons of the parafacial region regulate breathing rate, inspiration, and expiration in conscious rats. J Neurosci. 2011;31:16410–16422. - PMC - PubMed
    1. Abbott SB, Stornetta RL, Fortuna MG, Depuy SD, West GH, Harris TE, Guyenet PG. Photostimulation of retrotrapezoid nucleus phox2b-expressing neurons in vivo produces long-lasting activation of breathing in rats. J Neurosci. 2009;29:5806–5819. - PMC - PubMed

Publication types

LinkOut - more resources