. 2015 Dec 15;523(18):2752-68.
doi: 10.1002/cne.23814. Epub 2015 Jun 22.

Identification of B6SJL mSOD1(G93A) mouse subgroups with different disease progression rates

Affiliations

Identification of B6SJL mSOD1(G93A) mouse subgroups with different disease progression rates

Melissa M Haulcomb et al. J Comp Neurol. .

Abstract

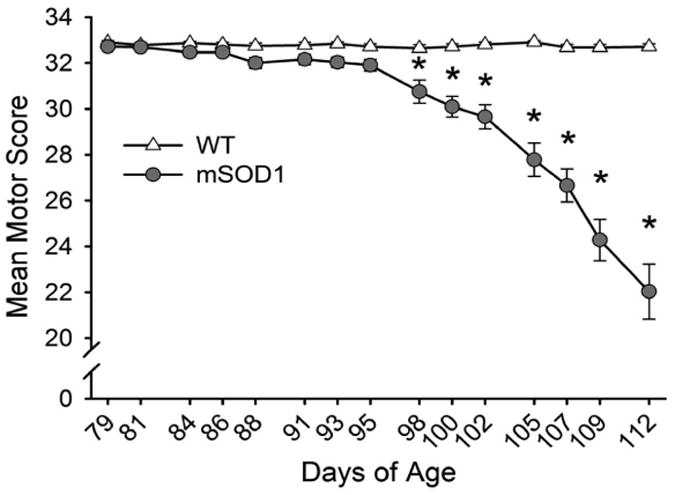
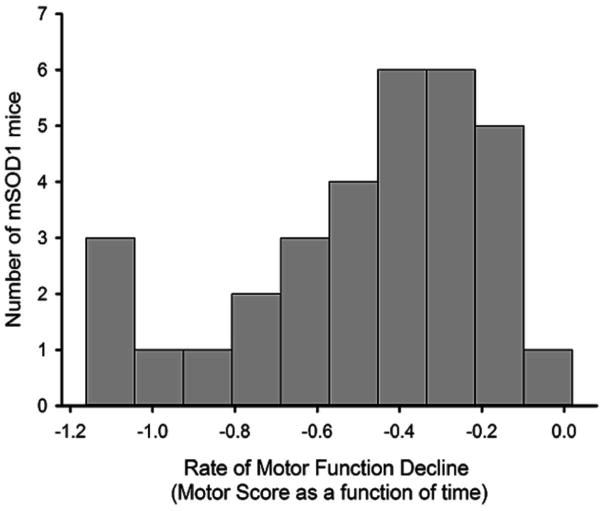
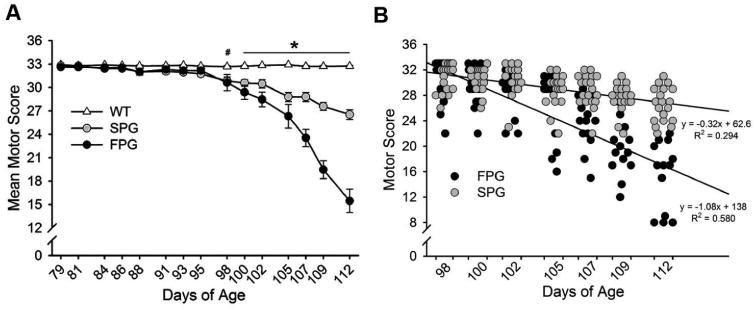
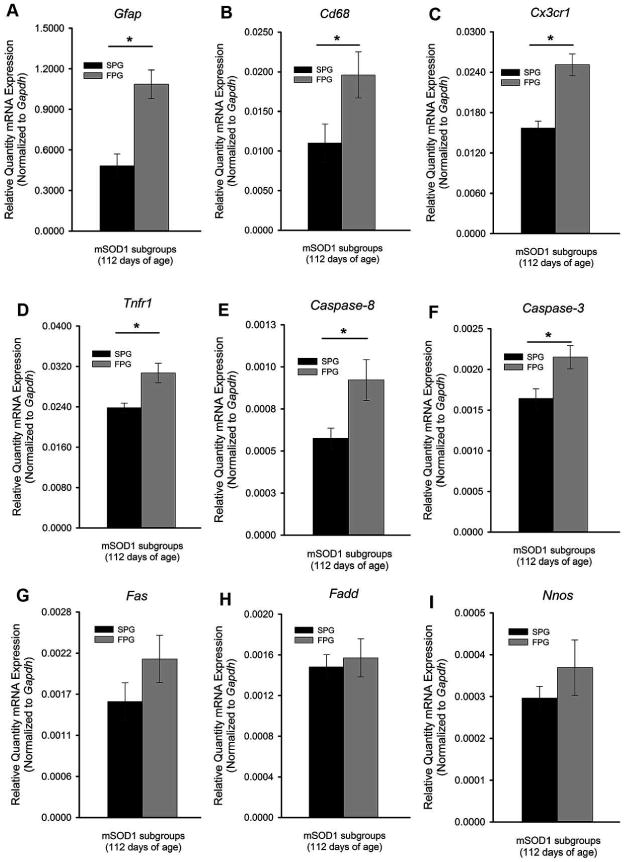
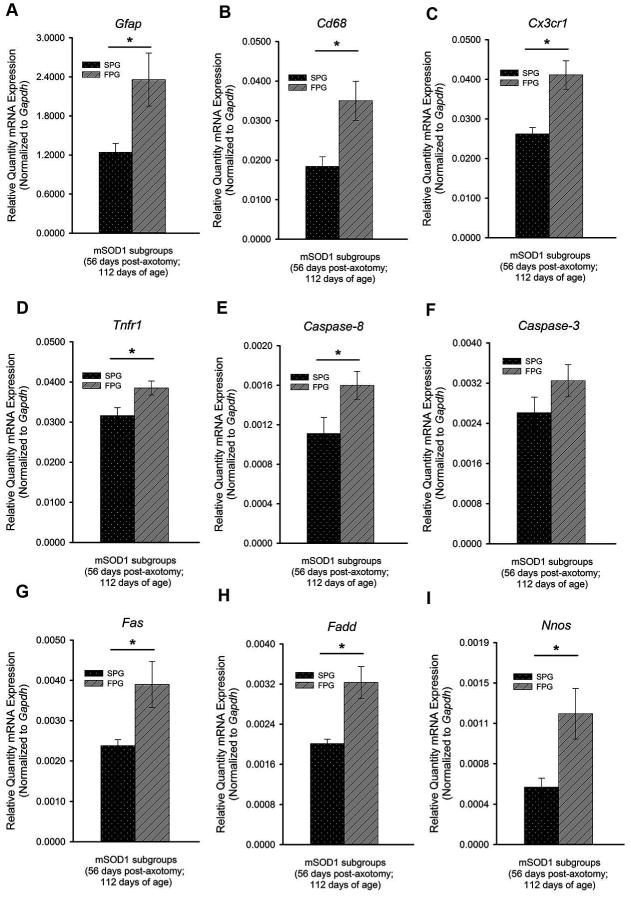
Disease progression rates among patients with amyotrophic lateral sclerosis (ALS) vary greatly. Although the majority of affected individuals survive 3-5 years following diagnosis, some subgroups experience a more rapidly progressing form, surviving less than 1 year, and other subgroups experience slowly progressing forms, surviving nearly 50 years. Genetic heterogeneity and environmental factors pose significant barriers in investigating patient progression rates. Similar to the case for humans, variation in survival within the mSOD1 mouse has been well documented, but different progression rates have not been investigated. The present study identifies two subgroups of B6SJL mSOD1(G93A) mice with different disease progression rates, a fast progression group (FPG) and slow progression group, as evidenced by differences in the rate of motor function decline. In addition, increased disease-associated gene expression within the FPG facial motor nucleus confirmed the presence of a more severe phenotype. We hypothesize that a more severe disease phenotype could be the result of 1) an earlier onset of axonal disconnection with a consistent degeneration rate or 2) a more severe or accelerated degenerative process. We performed a facial nerve transection axotomy in both mSOD1 subgroups prior to disease onset as a method to standardize the axonal disconnection. Instead of leading to comparable gene expression in both subgroups, this standardization did not eliminate the severe phenotype in the FPG facial nucleus, suggesting that the FPG phenotype is the result of a more severe or accelerated degenerative process. We theorize that these mSOD1 subgroups are representative of the rapid and slow disease phenotypes often experienced in ALS.

Keywords: ALS; MN; disease progression; facial nerve axotomy; gene expression; mSOD1; motoneuron.


Conflict of interest statement

Conflict of Interest Statement The authors declare that they have no conflict of interest.

Figures

Figure 1
Figure 1
A combination of six behavioral tests were used to evaluate the progression of motor deficits in WT (n = 31) and mSOD1G93A (n = 32) mice. Images depict mice on various testing days (between 79 and 112 days of age) performing the following tasks: extension reflex (A,G), paw-grip endurance (B,H), balance beam (C,I), gait analysis (D,J), tail elevation (E,K), and rearing behavior (F,L). A defined scoring system (see Materials and Methods) was used to evaluate motor function. Top row images (A-F) are representative of normal motor function, or higher value scores, while bottom row images (G-L) represent severe motor deficits, or low value scores.
Figure 2
Figure 2
Longitudinal analysis of motor deficits in mSOD1G93A mice. WT (n = 31) and mSOD1 (n = 32) mice were evaluated for motor deficits across time. Behavioral assessment began at 79 days of age and continued 3 times per week until 112 days of age. Data are presented as mean motor score ± SEM. Symptom onset was identified at 98 days of age, marking both the end of the pre-symptomatic stage and the beginning of the symptomatic stage. Two-way repeated measures ANOVA (group × age) with Student-Newman-Keuls multiple comparison post hoc test: * represents a significant difference between WT and mSOD1, at P ≤ 0.05.
Figure 3
Figure 3
Distribution of motor function decline. The rate or slope of motor function decline was calculated for individual mSOD1G93A mice using motor scores across time during the symptomatic stage of disease (from 98 to 112 days of age).
Figure 4
Figure 4
Longitudinal analysis of two mSOD1G93A groups with different disease progression rates, slow progression group (SPG) and fast progression group (FPG). A: Data are presented as mean score ± SEM across time. Two-way repeated measures ANOVA (group × age) with Student-Newman-Keuls multiple comparison post hoc test: * represents a significant difference between SPG (n = 19), FPG (n = 13) and WT (n = 31) mice; # represents a significant difference between WT and mSOD1 subgroups, at P ≤ 0.05. B: Scatter plot of individual mSOD1 motor scores within the symptomatic stage of disease (from 98 to 112 days of age). X-axis variables were widened (days of age) to allow for visualization of overlapping data points. Linear regression analysis was performed separately on each mSOD1 subgroup, revealing a 3.375-fold difference in disease progression rates.
Figure 5
Figure 5
Analysis of mRNA expression in the facial motor nucleus of mSOD1G93A subgroups in response to disease-induced facial motoneuron (FMN) target disconnection (TD). The facial motor nuclei of mSOD1 subgroups, fast (FPG; n=5) and slow progression group (SPG; n=7), at 112 days of age, were analyzed for mRNA expression (mean ± SEM) for the following genes: Gfap (A), Cd68 (B), Cx3cr1 (C), Tnfr1 (D), Caspase-8 (E), Caspase-3 (F), Fas (G), Fadd (H), and Nnos (I). Student's t-test: * represents a significant difference between subgroups, at P ≤ 0.05.
Figure 6
Figure 6
Analysis of mRNA expression in the facial motor nucleus of mSOD1G93A subgroups following standardization of axonal target disconnection (TD). Prior to disease onset a facial nerve transection axotomy was performed to standardize the onset of facial motoneuron (FMN) TD between the mSOD1 subgroups. The axotomized facial motor nuclei of mSOD1 subgroups, fast (FPG; n=5) and slow progression group (SPG; n=7), at 56 days post-axotomy (112 days of age), were analyzed for mRNA expression (mean ± SEM) for the following genes: Gfap (A), Cd68 (B), Cx3cr1 (C), Tnfr1 (D), Caspase-8 (E), Caspase-3 (F), Fas (G), Fadd (H), and Nnos (I). Student's t-test: * represents a significant difference between subgroups, at P ≤ 0.05.

References

    1. Abe K, Aoki M, Ikeda M, Watanabe M, Hirai S, Itoyama Y. Clinical characteristics of familial amyotrophic lateral sclerosis with Cu/Zn superoxide dismutase gene mutations. Journal of the neurological sciences. 1996;136(1-2):108–116. - PubMed
    1. Alexander GM, Erwin KL, Byers N, Deitch JS, Augelli BJ, Blankenhorn EP, Heiman-Patterson TD. Effect of transgene copy number on survival in the G93A SOD1 transgenic mouse model of ALS. Brain research Molecular brain research. 2004;130(1-2):7–15. - PubMed
    1. Armon C, Brandstater ME. Motor unit number estimate-based rates of progression of ALS predict patient survival. Muscle & nerve. 1999;22(11):1571–1575. - PubMed
    1. Ashwell KW. The adult mouse facial nerve nucleus: morphology and musculotopic organization. Journal of anatomy. 1982;135(Pt 3):531–538. - PMC - PubMed
    1. Brooks BR, Miller RG, Swash M, Munsat TL. El Escorial revisited: revised criteria for the diagnosis of amyotrophic lateral sclerosis. Amyotrophic lateral sclerosis and other motor neuron disorders: official publication of the World Federation of Neurology, Research Group on Motor Neuron Diseases. 2000;1(5):293–299. - PubMed

Publication types

MeSH terms