

Use of Advanced Magnetic Resonance Imaging Techniques in Neuromyelitis Optica Spectrum Disorder
- PMID: 26010909
- PMCID: PMC4828237
- DOI: 10.1001/jamaneurol.2015.0248
Use of Advanced Magnetic Resonance Imaging Techniques in Neuromyelitis Optica Spectrum Disorder
Abstract
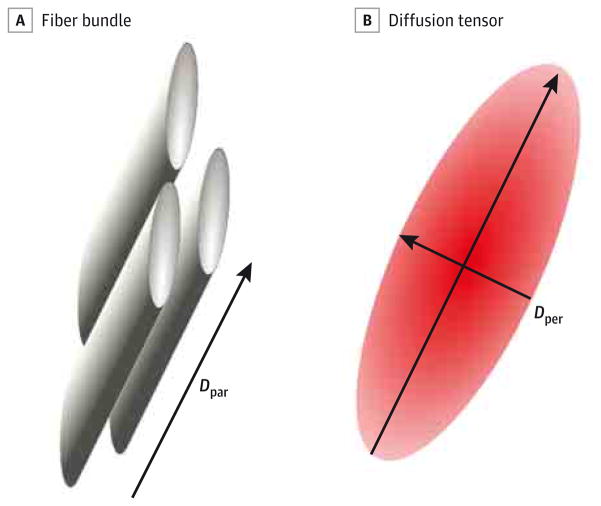
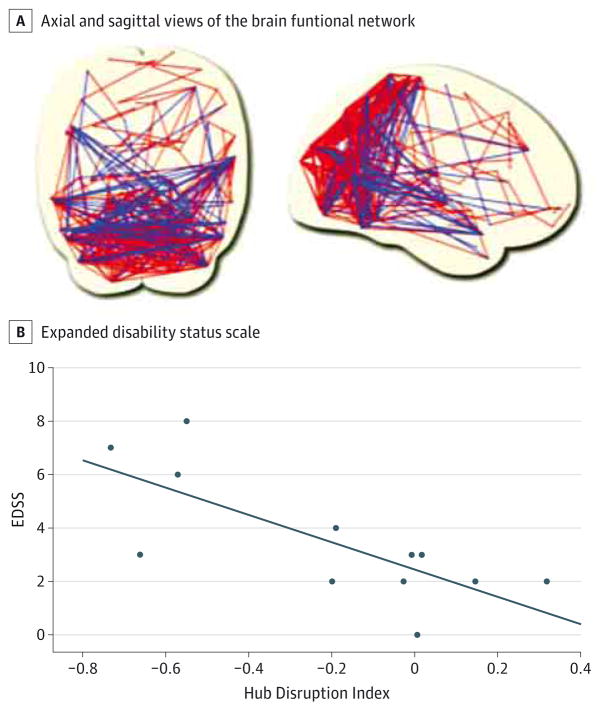
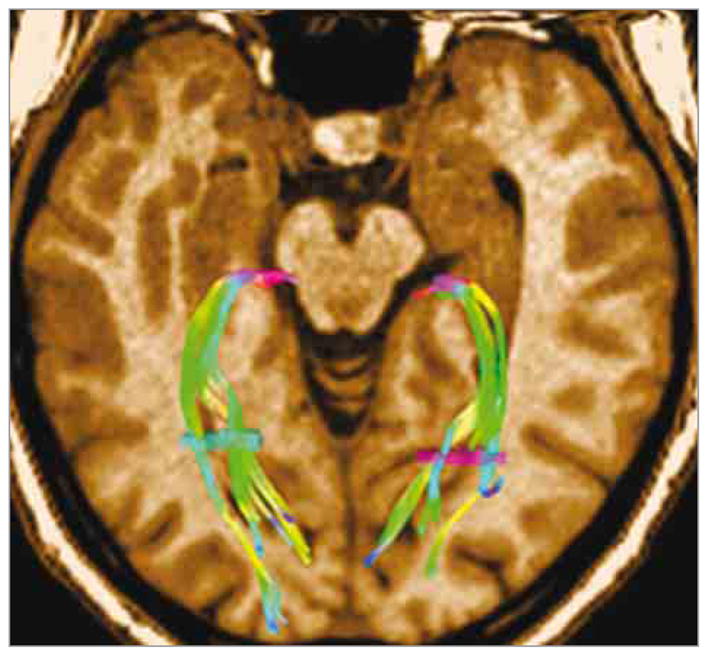
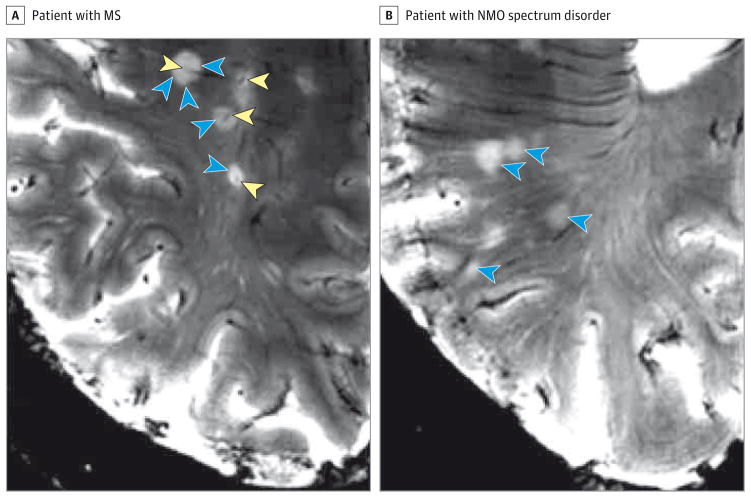
Brain parenchymal lesions are frequently observed on conventional magnetic resonance imaging (MRI) scans of patients with neuromyelitis optica (NMO) spectrum disorder, but the specific morphological and temporal patterns distinguishing them unequivocally from lesions caused by other disorders have not been identified. This literature review summarizes the literature on advanced quantitative imaging measures reported for patients with NMO spectrum disorder, including proton MR spectroscopy, diffusion tensor imaging, magnetization transfer imaging, quantitative MR volumetry, and ultrahigh-field strength MRI. It was undertaken to consider the advanced MRI techniques used for patients with NMO by different specialists in the field. Although quantitative measures such as proton MR spectroscopy or magnetization transfer imaging have not reproducibly revealed diffuse brain injury, preliminary data from diffusion-weighted imaging and brain tissue volumetry indicate greater white matter than gray matter degradation. These findings could be confirmed by ultrahigh-field MRI. The use of nonconventional MRI techniques may further our understanding of the pathogenic processes in NMO spectrum disorders and may help us identify the distinct radiographic features corresponding to specific phenotypic manifestations of this disease.
Figures
References
-
- Ito S, Mori M, Makino T, Hayakawa S, Kuwabara S. “Cloud-like enhancement” is a magnetic resonance imaging abnormality specific to neuromyelitis optica. Ann Neurol. 2009;66(3):425–428. - PubMed
-
- Makino T, Ito S, Mori M, Yonezu T, Ogawa Y, Kuwabara S. Diffuse and heterogeneous T2-hyperintense lesions in the splenium are characteristic of neuromyelitis optica. Mult Scler. 2013;19(3):308–315. - PubMed
-
- Pittock SJ, Weinshenker BG, Lucchinetti CF, Wingerchuk DM, Corboy JR, Lennon VA. Neuromyelitis optica brain lesions localized at sites of high aquaporin 4 expression. Arch Neurol. 2006;63(7):964–968. - PubMed
-
- Yonezu T, Ito S, Mori M, et al. “Bright spotty lesions” on spinal magnetic resonance imaging differentiate neuromyelitis optica from multiple sclerosis. Mult Scler. 2014;20(3):331–337. - PubMed
Publication types
MeSH terms
Grants and funding
LinkOut - more resources
Full Text Sources
Other Literature Sources
Medical
