Randomized Controlled Trial
. 2015 May 26;10(5):e0127012.
doi: 10.1371/journal.pone.0127012. eCollection 2015.

Hyperbaric oxygen therapy can diminish fibromyalgia syndrome--prospective clinical trial

Affiliations
Randomized Controlled Trial

Hyperbaric oxygen therapy can diminish fibromyalgia syndrome--prospective clinical trial

Shai Efrati et al. PLoS One. .

Abstract

Background: Fibromyalgia Syndrome (FMS) is a persistent and debilitating disorder estimated to impair the quality of life of 2-4% of the population, with 9:1 female-to-male incidence ratio. FMS is an important representative example of central nervous system sensitization and is associated with abnormal brain activity. Key symptoms include chronic widespread pain, allodynia and diffuse tenderness, along with fatigue and sleep disturbance. The syndrome is still elusive and refractory. The goal of this study was to evaluate the effect of hyperbaric oxygen therapy (HBOT) on symptoms and brain activity in FMS.

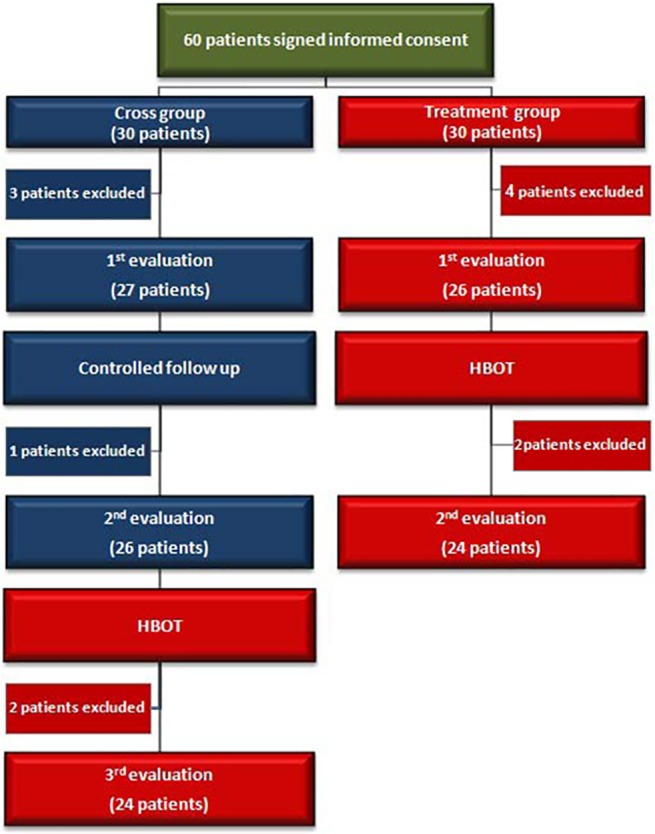
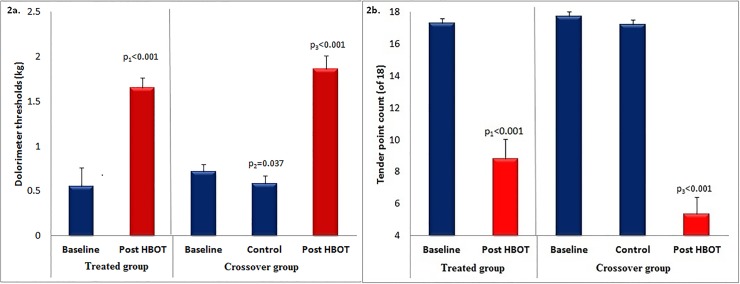
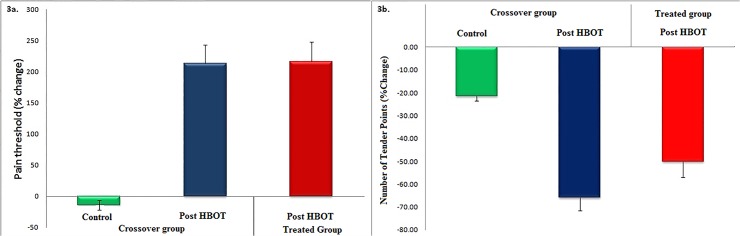
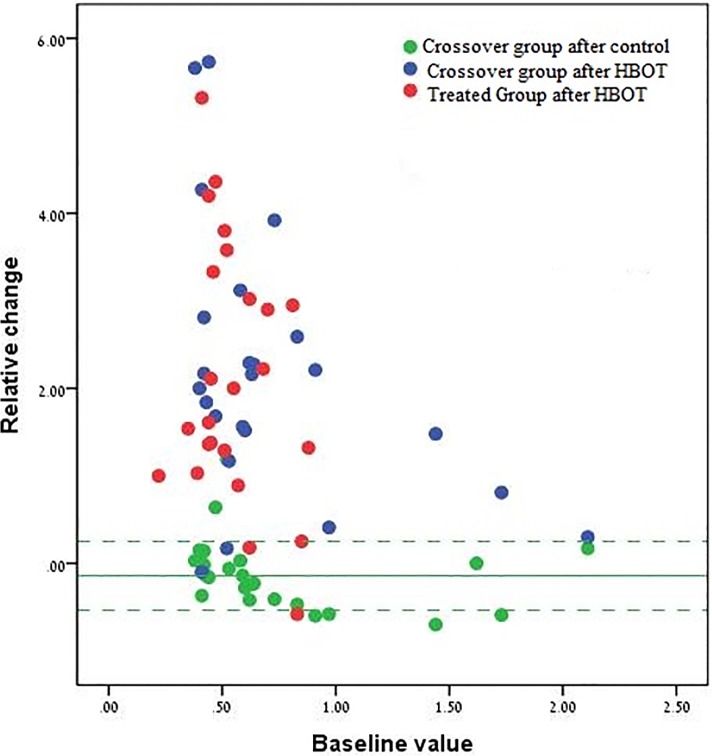
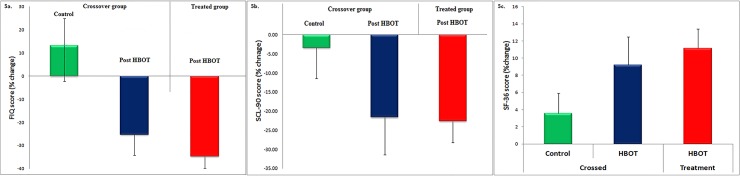
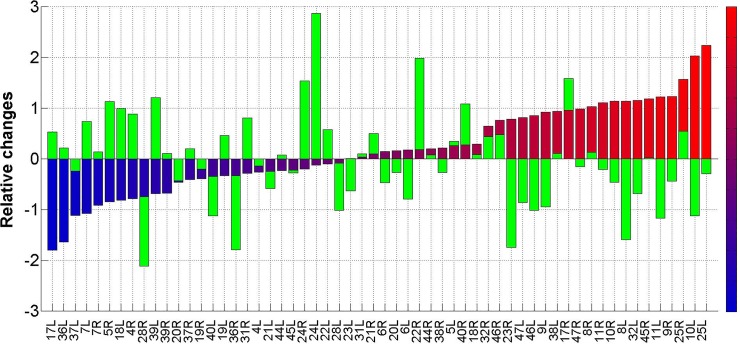
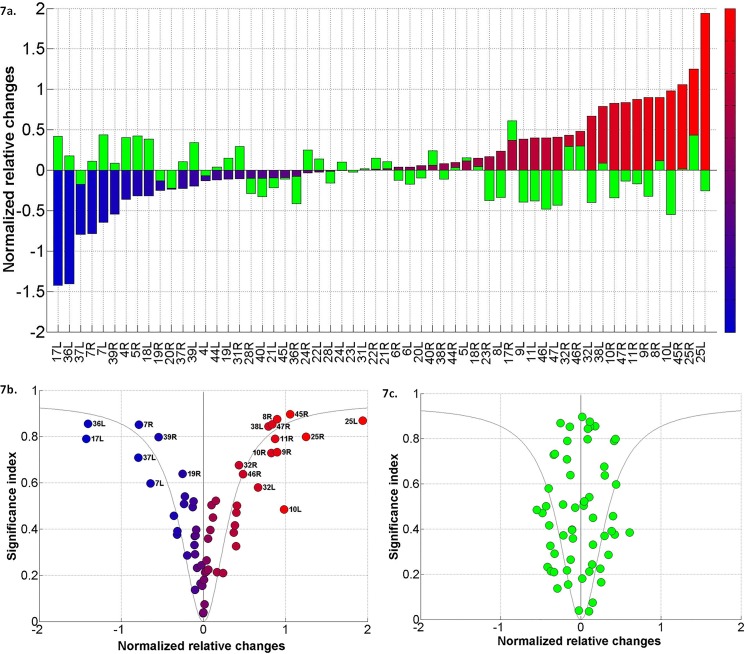
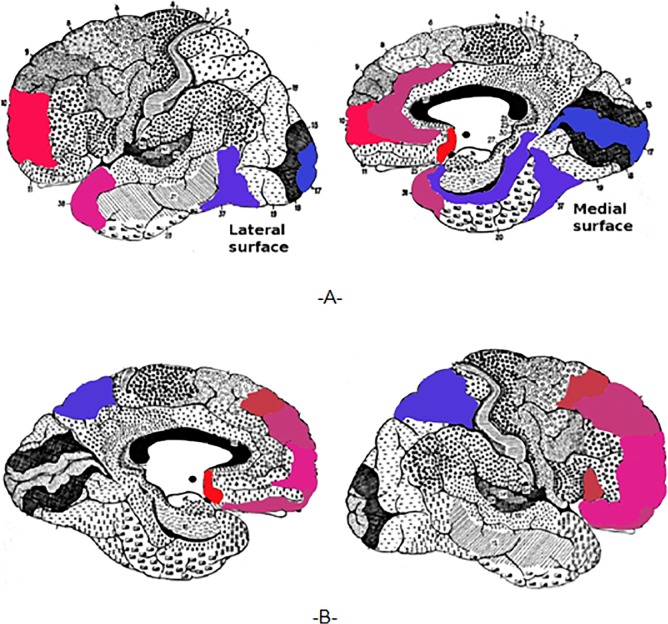
Methods and findings: A prospective, active control, crossover clinical trial. Patients were randomly assigned to treated and crossover groups: The treated group patients were evaluated at baseline and after HBOT. Patients in the crossover-control group were evaluated three times: baseline, after a control period of no treatment, and after HBOT. Evaluations consisted of physical examination, including tender point count and pain threshold, extensive evaluation of quality of life, and single photon emission computed tomography (SPECT) imaging for evaluation of brain activity. The HBOT protocol comprised 40 sessions, 5 days/week, 90 minutes, 100% oxygen at 2ATA. Sixty female patients were included, aged 21-67 years and diagnosed with FMS at least 2 years earlier. HBOT in both groups led to significant amelioration of all FMS symptoms, with significant improvement in life quality. Analysis of SPECT imaging revealed rectification of the abnormal brain activity: decrease of the hyperactivity mainly in the posterior region and elevation of the reduced activity mainly in frontal areas. No improvement in any of the parameters was observed following the control period.

Conclusions: The study provides evidence that HBOT can improve the symptoms and life quality of FMS patients. Moreover, it shows that HBOT can induce neuroplasticity and significantly rectify abnormal brain activity in pain related areas of FMS patients.

Trial registration: ClinicalTrials.gov NCT01827683.


Conflict of interest statement

Competing Interests: The authors have declared that no competing interests exist.

Figures

Fig 1
Fig 1. Flow chart of the patients in the study.
Fig 2
Fig 2. The HBOT effects on tender points.
A) The effect on dolorimeter threshold. For both groups, the threshold level tripled after treatment (about 1.5, red bars, vs. about 0.5, blue bars). B) The effect on the number of tender points. The treatment led to significant reduction in the number of tender points in both groups: by a factor of 2 in the treated group and by a factor of 3 in the crossover group.
Fig 3
Fig 3. Assessments of the mean relative changes in the pain level.
A) The mean relative change and standard errors in the dolorimeter thresholds for the crossover group following the control period (green) and following HBOT (blue), and for the treated group following HBOT (red). B) The mean relative changes and standard errors in the number of tender points for the crossover group following the control period (green) and following HBOT (blue), and for the treated group following HBOT (red).
Fig 4
Fig 4. Scatter plot of the individual relative changes in the dolorimeter threshold.
The figure shows the relative change in all patients (y-axis in unit change) as a function of the baseline value. For the treated group, each patient is represented by a single red dot. The relative change is the change during HBOT and the baseline value is the value before treatment. For the crossover group, each patient is represented by two dots: a green dot represents the relative change during the control period, with the baseline being the value before the control. A blue dot represents the relative change during treatment, with the baseline value being the value before treatment (which is also the value at the end of the control period). The green line represents the mean relative change in the crossover group following the control period and the green dashed lines represent the ±1std from the mean.
Fig 5
Fig 5. Assessments of the mean relative changes in the FIQ, SCL-90 and the SF-36 scores.
The figures show the mean relative changes and standard errors in the three measures for the crossover group following the control period (green) and following HBOT (blue), and for the treated group following HBOT (red). A) Mean relative changes and standard errors in physical function assessed by the FIQ score. B) Mean relative changes in and standard errors in the psychological distress assessed by the SCL-90 score. c) Mean relative changes and standard errors in the quality of life assessed by the SF-36 score.
Fig 6
Fig 6. BA histogram of mean relative changes.
The figure shows the histogram as is explained in the text. The Y-axis shows the mean relative change change>(n) for the Brodmann area indicated in the X-axis. The results for the patients of the response group after the HBOT period are colored from light blue (BA with the strongest activity reduction) to light red (BA with the highest activity elevation). The green bars correspond to the mean relative changes in the patients of the crossover group following the control period.
Fig 7
Fig 7. The effect of significance index normalization.
A) Normalized BA histogram of mean relative changes. The figure is similar to Fig 6 but the Y-axis is for the normalized values, that is for Iσ(n)* <Rchange>(n) and not for <Rchange>(n) that are used in Fig 6. The BAs within the rectangles are the ones with normalized mean relative changes smaller than -0.6 or larger than +0.6. B) The two dimensional scatter plot Iσ(n) vs. Iσ(n)* <Rchange>(n) for the patients of the response group following the HBOT period. C) Similar scatter plot for the patients in the crossover group following the control period. The color code in (B) and (C) is the same as in (A). The funnel shaped black curve is a fit of the results in (B) to a reciprocal Lorentzian curve: f(x) = {Xmax- γ*[π*(γ2+x2)]-1} with Xmax = 0.95, γ = 0.335.
Fig 8
Fig 8. Projection of the significant changes on the brain maps.
The figure shows the results of the normalized mean changes as projected on the brain maps, left BAs (A) and right BAs (B). We colored the BAs that show significant changes in activity using the same color code as in Figs 6 and 7 - from light blue (BA with the strongest activity reduction) to light red (BA with the highest activity elevation).

References

    1. Clauw DJ, Arnold LM, McCarberg BH. The science of fibromyalgia. Mayo Clin Proc. 2011; 86(9): 907–11. 10.4065/mcp.2011.0206 - DOI - PMC - PubMed
    1. Arnold LM, Crofford LJ, Mease PJ, Burgess SM, Palmer SC, Abetz L, et al. Patient perspectives on the impact of fibromyalgia. Patient Educ Couns. 2008; 73(1): 114–20. 10.1016/j.pec.2008.06.005 - DOI - PMC - PubMed
    1. Schmidt-Wilcke T, Clauw DJ. Fibromyalgia: from pathophysiology to therapy. Nat Rev Rheumatol. 2011; 7(9): 518–27. 10.1038/nrrheum.2011.98 - DOI - PubMed
    1. Sarzi-Puttini P, Atzeni F, Mease PJ. Chronic widespread pain: from peripheral to central evolution. Best Pract Res Clin Rheumatol. 2011; 25(2): 133–9. 10.1016/j.berh.2011.04.001 - DOI - PubMed
    1. Wolfe F. Fibromyalgianess. Arthritis Rheum. 2009; 61(6): 715–6. 10.1002/art.24553 - DOI - PubMed

Publication types

Associated data