

Continuous versus group sequential analysis for post-market drug and vaccine safety surveillance
- PMID: 26011024
- PMCID: PMC4888780
- DOI: 10.1111/biom.12324
Continuous versus group sequential analysis for post-market drug and vaccine safety surveillance
Abstract
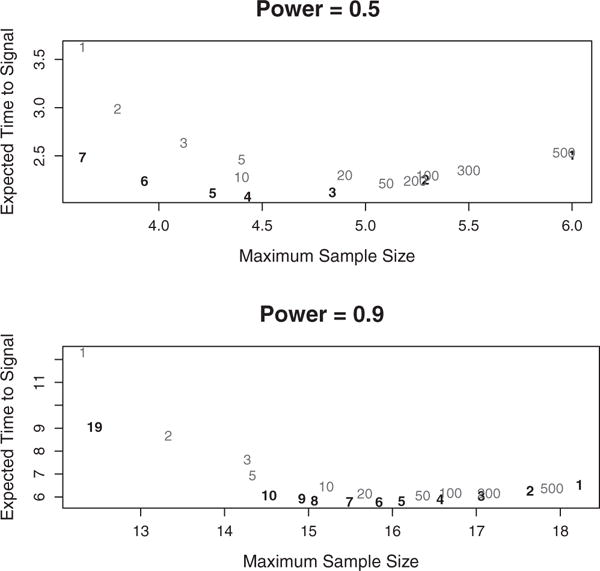
The use of sequential statistical analysis for post-market drug safety surveillance is quickly emerging. Both continuous and group sequential analysis have been used, but consensus is lacking as to when to use which approach. We compare the statistical performance of continuous and group sequential analysis in terms of type I error probability; statistical power; expected time to signal when the null hypothesis is rejected; and the sample size required to end surveillance without rejecting the null. We present a mathematical proposition to show that for any group sequential design there always exists a continuous sequential design that is uniformly better. As a consequence, it is shown that more frequent testing is always better. Additionally, for a Poisson based probability model and a flat rejection boundary in terms of the log likelihood ratio, we compare the performance of various continuous and group sequential designs. Using exact calculations, we found that, for the parameter settings used, there is always a continuous design with shorter expected time to signal than the best group design. The two key conclusions from this article are (i) that any post-market safety surveillance system should attempt to obtain data as frequently as possible, and (ii) that sequential testing should always be performed when new data arrives without deliberately waiting for additional data.
Keywords: Exact sequential analysis; Expected time to signal; Post-market safety surveillance; Uniformly better sequential design.
© 2015, The International Biometric Society.
Figures
Similar articles
-
A seasonality-adjusted sequential test for vaccine safety surveillance.Biometrics. 2023 Dec;79(4):3533-3548. doi: 10.1111/biom.13829. Epub 2023 Jan 30. Biometrics. 2023. PMID: 36645553 Free PMC article.
-
Type I error probability spending for post-market drug and vaccine safety surveillance with binomial data.Stat Med. 2018 Jan 15;37(1):107-118. doi: 10.1002/sim.7504. Epub 2017 Sep 25. Stat Med. 2018. PMID: 28948642 Free PMC article.
-
[The application of sequential analysis for continuous post-market vaccine safety surveillance].Zhonghua Liu Xing Bing Xue Za Zhi. 2025 Mar 10;46(3):514-518. doi: 10.3760/cma.j.cn112338-20240807-00482. Zhonghua Liu Xing Bing Xue Za Zhi. 2025. PMID: 40113405 Chinese.
-
Leveraging the entire cohort in drug safety monitoring: part 1 methods for sequential surveillance that use regression adjustment or weighting to control confounding in a multisite, rare event, distributed data setting.J Clin Epidemiol. 2019 Aug;112:77-86. doi: 10.1016/j.jclinepi.2019.04.012. Epub 2019 May 18. J Clin Epidemiol. 2019. PMID: 31108199 Review.
-
A primer of drug safety surveillance: an industry perspective. Part III: Managing adverse-event data.J Pharm Technol. 1992 Nov-Dec;8(6):259-73. doi: 10.1177/875512259200800608. J Pharm Technol. 1992. PMID: 10122649 Review.
Cited by
-
A Synthesis of Current Surveillance Planning Methods for the Sequential Monitoring of Drug and Vaccine Adverse Effects Using Electronic Health Care Data.EGEMS (Wash DC). 2016 Sep 6;4(1):1219. doi: 10.13063/2327-9214.1219. eCollection 2016. EGEMS (Wash DC). 2016. PMID: 27713904 Free PMC article.
-
A seasonality-adjusted sequential test for vaccine safety surveillance.Biometrics. 2023 Dec;79(4):3533-3548. doi: 10.1111/biom.13829. Epub 2023 Jan 30. Biometrics. 2023. PMID: 36645553 Free PMC article.
-
Exact conditional maximized sequential probability ratio test adjusted for covariates.Seq Anal. 2019;38(1):115-133. doi: 10.1080/07474946.2019.1574446. Epub 2019 May 13. Seq Anal. 2019. PMID: 32153315 Free PMC article.
-
Alpha spending for historical versus surveillance Poisson data with CMaxSPRT.Stat Med. 2019 May 30;38(12):2126-2138. doi: 10.1002/sim.8097. Epub 2019 Jan 28. Stat Med. 2019. PMID: 30689224 Free PMC article.
-
A Bayesian approach to sequential analysis in post-licensure vaccine safety surveillance.Pharm Stat. 2020 May;19(3):291-302. doi: 10.1002/pst.1991. Epub 2019 Dec 22. Pharm Stat. 2020. PMID: 31867860 Free PMC article.
References
-
- Abt K. Poisson sequential sampling modified towards maximal safety in adverse event monitoring. Biometrical Journal. 1998;40:21–41.
-
- Belongia E, Irving S, Shui I, Kulldorff M, Lewis E, Yin R, Lieu T, Weintraub E, Yih W, Li R, Baggs J, the Vaccine Safety Datalink Investigation Group Real-time surveillance to assess risk of intussusception and other adverse events after pentavalent, bovine-derived rotavirus vaccine. Pediatric Infectious Disease Journal. 2010;29:1–5. - PubMed
-
- Chi Y, Chen C. Curtailed two-stage designs in phase II clinical trials. Statistics in Medicine. 2008;27:6175–6189. - PubMed
-
- Davis R, Kolczak M, Lewis E, Nordin J, Goodman M, Shay D, Platt R, Black S, Shinefield H, Chen R. Active surveillance of vaccine safety: A system to detect early signs of adverse events. Epidemiology. 2005;16:336–341. - PubMed
-
- Jennison V, Turnbull B. Group Sequential Methods with Applications to Clinical Trials. London: Chapman and Hall/CRC; 2000.
Publication types
MeSH terms
Grants and funding
LinkOut - more resources
Full Text Sources
Other Literature Sources
Medical
Research Materials
