. 2015 May 26:6:7233.
doi: 10.1038/ncomms8233.

Quantifying the ozone and ultraviolet benefits already achieved by the Montreal Protocol

Affiliations

Quantifying the ozone and ultraviolet benefits already achieved by the Montreal Protocol

M P Chipperfield et al. Nat Commun. .

Abstract

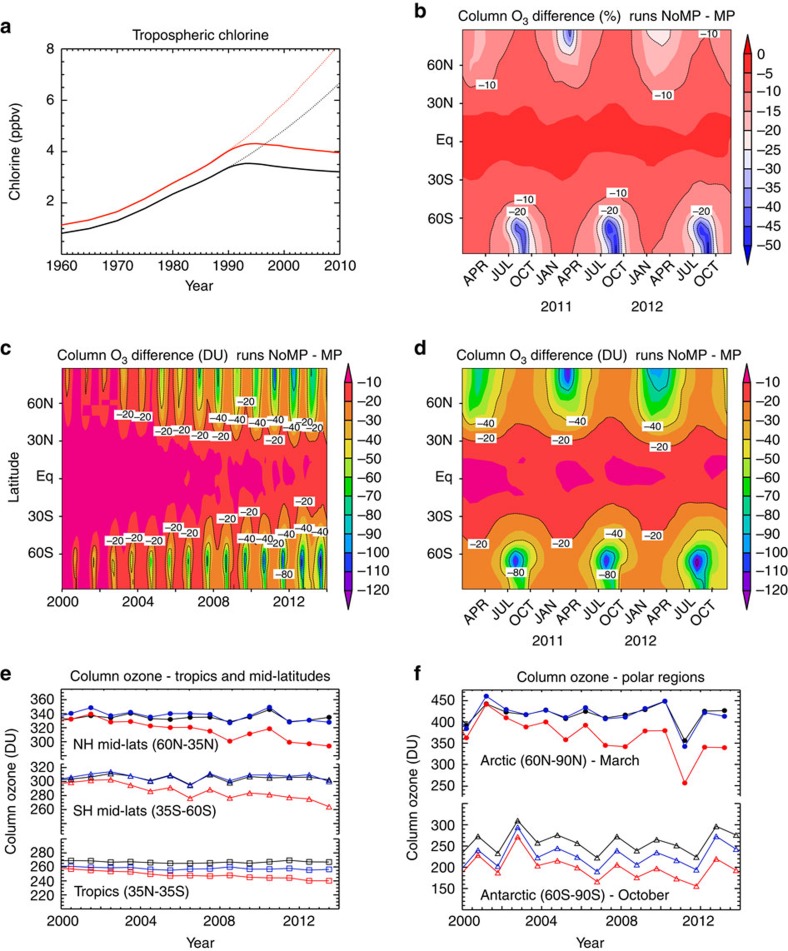
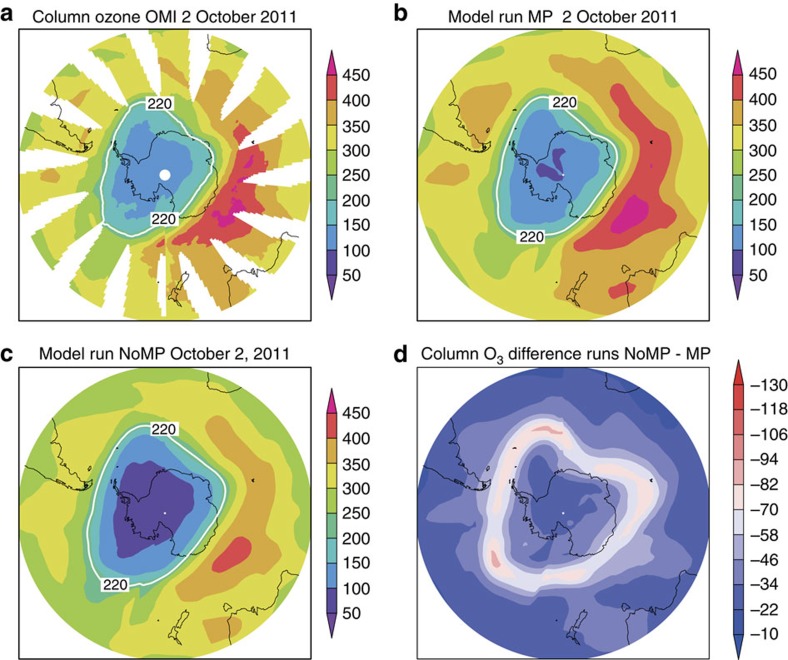
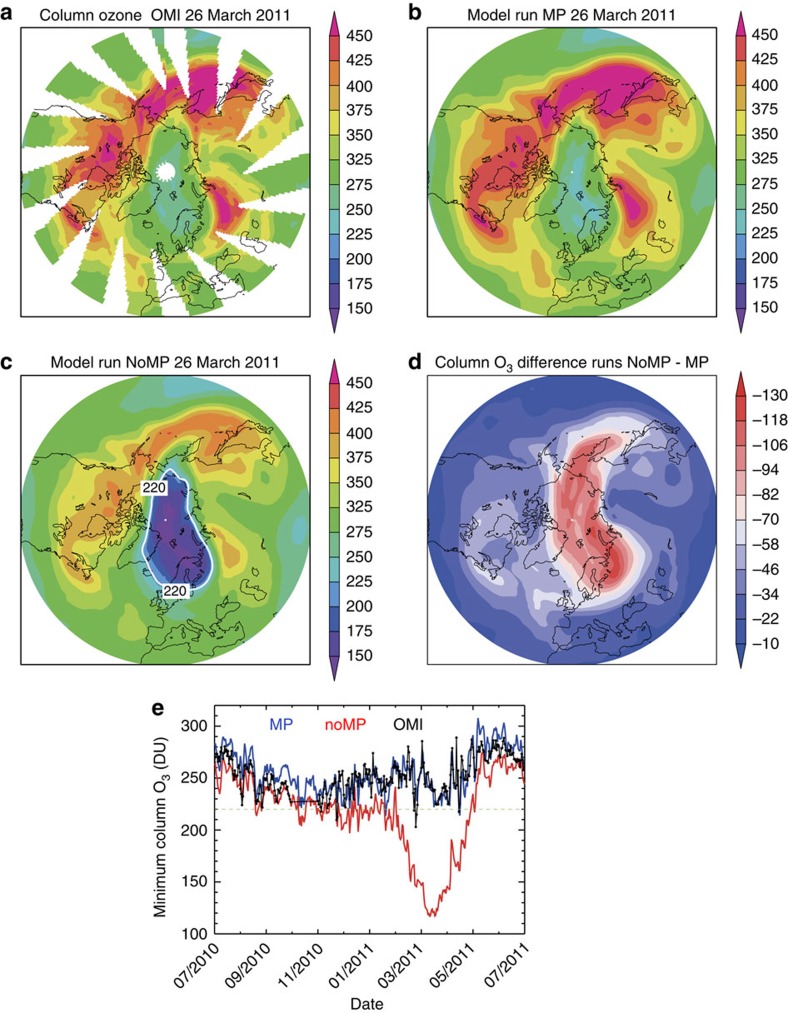
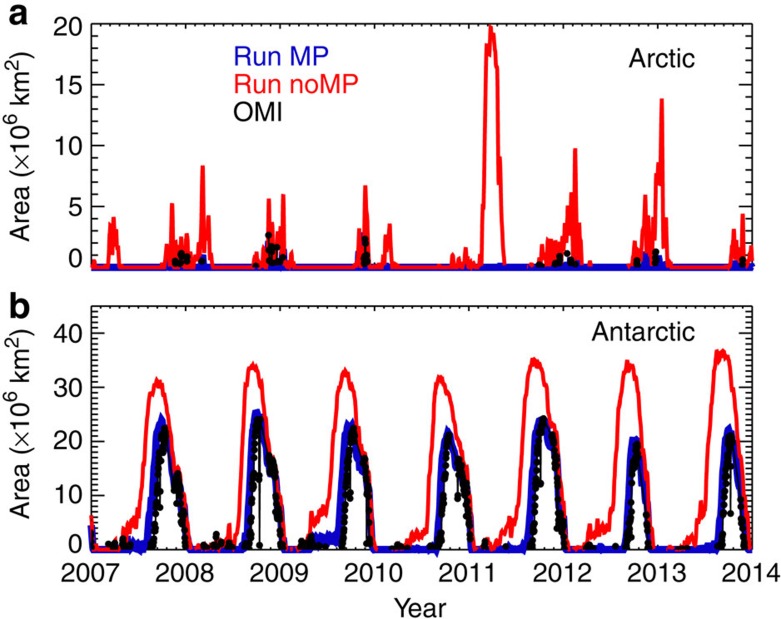
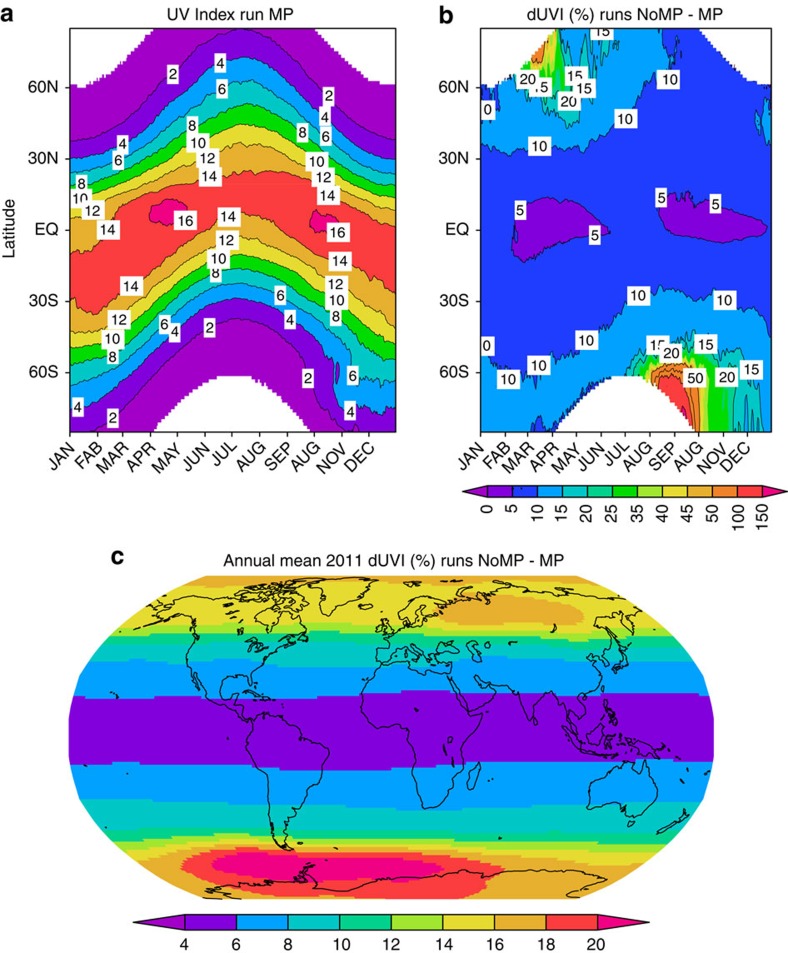
Chlorine- and bromine-containing ozone-depleting substances (ODSs) are controlled by the 1987 Montreal Protocol. In consequence, atmospheric equivalent chlorine peaked in 1993 and has been declining slowly since then. Consistent with this, models project a gradual increase in stratospheric ozone with the Antarctic ozone hole expected to disappear by ∼2050. However, we show that by 2013 the Montreal Protocol had already achieved significant benefits for the ozone layer. Using a 3D atmospheric chemistry transport model, we demonstrate that much larger ozone depletion than observed has been avoided by the protocol, with beneficial impacts on surface ultraviolet. A deep Arctic ozone hole, with column values <120 DU, would have occurred given meteorological conditions in 2011. The Antarctic ozone hole would have grown in size by 40% by 2013, with enhanced loss at subpolar latitudes. The decline over northern hemisphere middle latitudes would have continued, more than doubling to ∼15% by 2013.


Figures

Figure 1
Figure 1. Calculated impact of Montreal Protocol on atmospheric halogens and column ozone.
(a) Time series of surface chlorine (black) and surface equivalent chlorine (chlorine+50 × bromine, red) from observations (solid lines) and assumed 3% growth (dotted lines). (bd) The difference in zonal mean monthly mean column ozone (DU) between run MP and run NoMP for (b) 2010–2012 (%), (c) 2000–2013 (DU) and (d) 2010–2012 (DU). (d) The same results as c on an expanded time axis for clarity. (b) The same results as d but as a percentage change. (e, f) Comparisons of SBUV observed column ozone in different latitude regions (black) with model runs MP (blue) and NoMP (red).
Figure 2
Figure 2. Column ozone in the Antarctic from satellite observations and model for October 2011.
Column ozone (DU) on 2 October 2011 (a) observed by OMI, (b) from model run MP and (c) from model run NoMP (with the 220 DU contour indicated in white). (d) Difference in column ozone between runs NoMP and MP.
Figure 3
Figure 3. Evolution of column ozone in the Arctic from satellite observations and model for winter 2010/11.
Column ozone (DU) on 26 March 2011 (a) observed by OMI, (b) from model run MP and (c) from model run NoMP (with the 220 DU contour indicated in white). (d) Difference in column ozone between runs NoMP and MP. (e) The daily minimum O3 column in the Arctic region (latitude >45°N) from mid-2010 to mid-2011 as observed by OMI (black points), along with equivalent model results from run MP (blue) and run NoMP (red).
Figure 4
Figure 4. Area extent of the Antarctic and Arctic ozone holes.
The area of the ozone hole is defined as the area with column ozone<220 DU. (b) The observed area of the Antarctic ozone hole from 2007 to 2014 estimated from OMI data (black symbols). (a) For the Arctic, the observed ozone hole area is near zero in all years. The figure also includes the ozone hole areas calculated from model runs MP (blue) and NoMP (red).
Figure 5
Figure 5. The impact of the Montreal Protocol on surface ultraviolet index for 2011.
(a) The daily zonal mean sea-level ultraviolet index at local noon calculated from the column ozone from run MP and a radiative transfer model. (b) The percentage difference in daily zonal mean ultraviolet index at local noon between model run NoMP and run MP. (c) The percentage difference in annual mean ultraviolet index at local noon between model run NoMP and run MP.

References

    1. Molina M. J. & Rowland F. S. Stratospheric sink for chlorofluoromethanes: chlorine atom-catalysed destruction of ozone. Nature 249, 810–812 (1974).
    1. Farman J. C., Gardiner B. G. & Shanklin J. D. Large losses of total ozone in Antarctica reveal seasonal ClOx/NOx interaction. Nature 315, 207–210 (1985).
    1. Solomon S. Stratospheric ozone depletion: a review of concepts and history. Rev. Geophys. 37, 275–316 (1999).
    1. Salawitch R. J. et al. Chemical loss of ozone in the Arctic polar vortex in the winter of 1991-1992. Science 261, 1146–1149 (1993). - PubMed
    1. Rex M. et al. Prolonged stratospheric ozone loss in the 1995-96 Arctic winter. Nature 389, 835–838 (1997).

Publication types