

Age, risk, and life expectancy in Norwegian intensive care: a registry-based population modelling study
- PMID: 26011281
- PMCID: PMC4444302
- DOI: 10.1371/journal.pone.0125907
Age, risk, and life expectancy in Norwegian intensive care: a registry-based population modelling study
Abstract
Background: Knowledge about the expected life years gained from intensive care unit (ICU) admission could inform priority-setting decisions across groups of ICU patients and across medical specialties. The aim of this study was to estimate expected remaining lifetime for patients admitted to ICUs during 2008-2010 and to estimate the gain in life years from ICU admission.
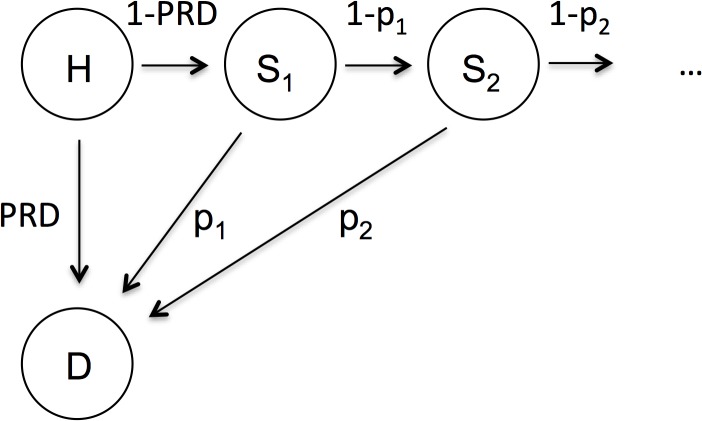
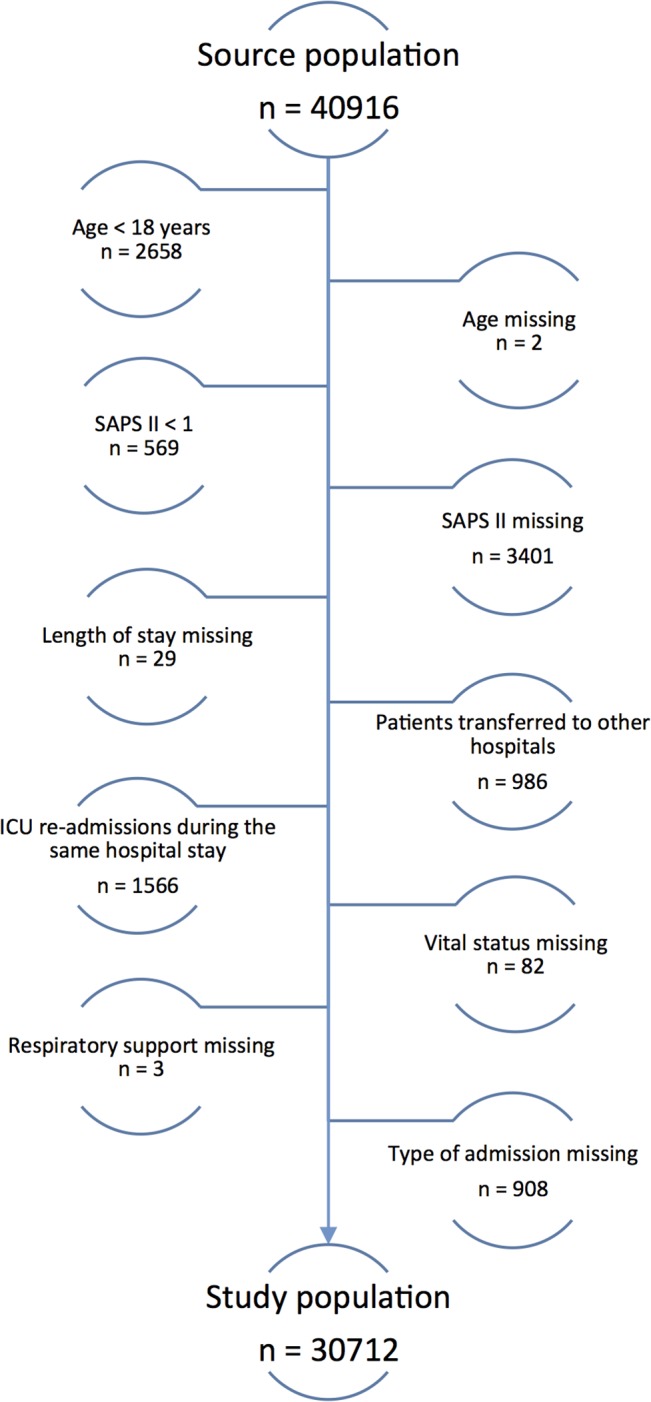
Methods: This is a descriptive, population modelling study of 30,712 adult mixed ICU admissions from the Norwegian Intensive Care Registry. The expected remaining lifetime for each patient was estimated using a decision-analytical model. Transition probabilities were based on registered Simplified Acute Physiology Score (SAPS) II, and standard and adjusted Norwegian life-tables.
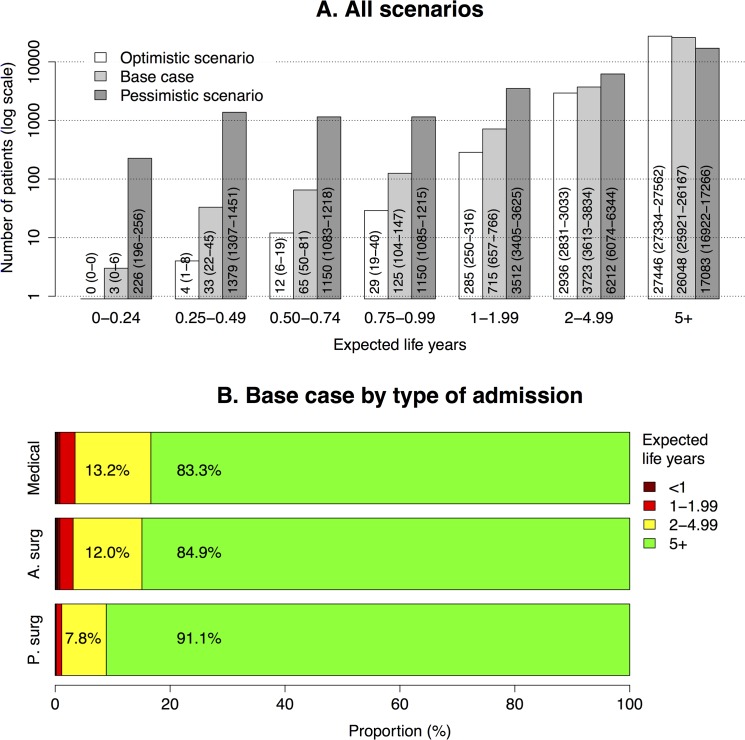
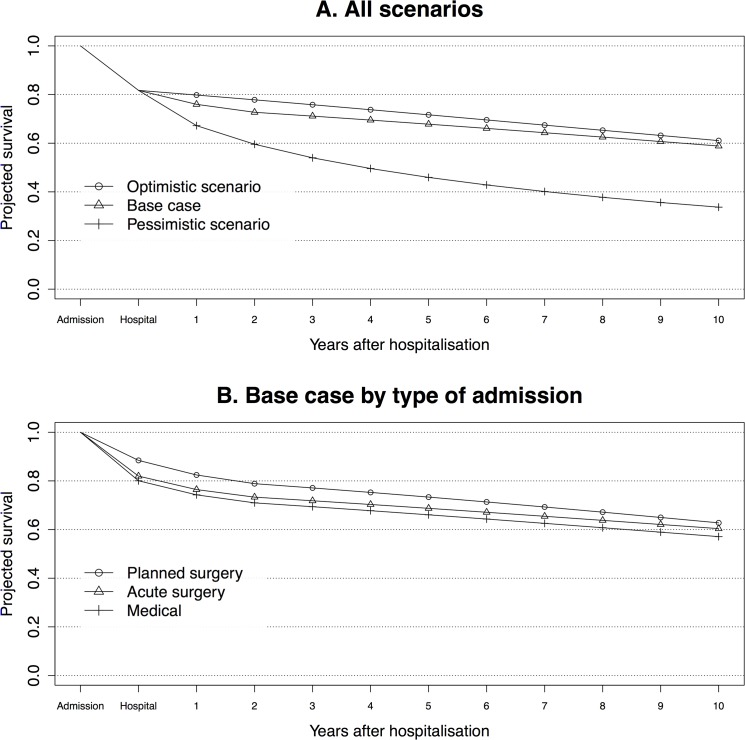
Results: The hospital mortality was 19.4% (n = 5,958 deaths). 24% of the patients were estimated to die within the first year after ICU admission in our model. Under an intermediate (base case), optimistic (O), and pessimistic (P) scenario with respect to long-term mortality, the average expected remaining lifetime was 19.4, 19.9, and 12.7 years. The majority of patients had a life expectancy of more than five years (84.8% in the base case, 89.4% in scenario O, and 55.6% in scenario P), and few had a life expectancy of less than one year (0.7%, 0.1%, and 12.7%). The incremental gain from ICU admission compared to counterfactual general ward care was estimated to be 0.04 (scenario P, age 85+) to 1.14 (scenario O, age < 45) extra life years per patient.
Conclusions: Our research demonstrated a novel way of using routinely collected registry data to estimate and evaluate the expected lifetime outcomes for ICU patients upon admission. The majority had high life expectancies. The youngest age groups seemed to benefit the most from ICU admission. The study raises the question whether availability and rationing of ICU services are too strict in Norway.
Conflict of interest statement
Figures
References
-
- American Thoracic Society. Fair allocation of intensive care unit resources. Am J Respir Crit Care Med. 1997;156: 1282–1301. - PubMed
-
- Ward NS, Levy MM. Rationing and critical care medicine. Crit Care Med. 2007;35: S102–105. - PubMed
-
- Sprung CL, Levin PD. Modifying triage decisions to optimize long-term outcomes In: Carlet J, Angus DC, editors. Surviving intensive care. New York: Springer; 2004. pp. 235–246.
MeSH terms
LinkOut - more resources
Full Text Sources
Other Literature Sources
