

Differential reactivation of fetal/neonatal genes in mouse liver tumors induced in cirrhotic and non-cirrhotic conditions
- PMID: 26011625
- PMCID: PMC4556385
- DOI: 10.1111/cas.12700
Differential reactivation of fetal/neonatal genes in mouse liver tumors induced in cirrhotic and non-cirrhotic conditions
Abstract
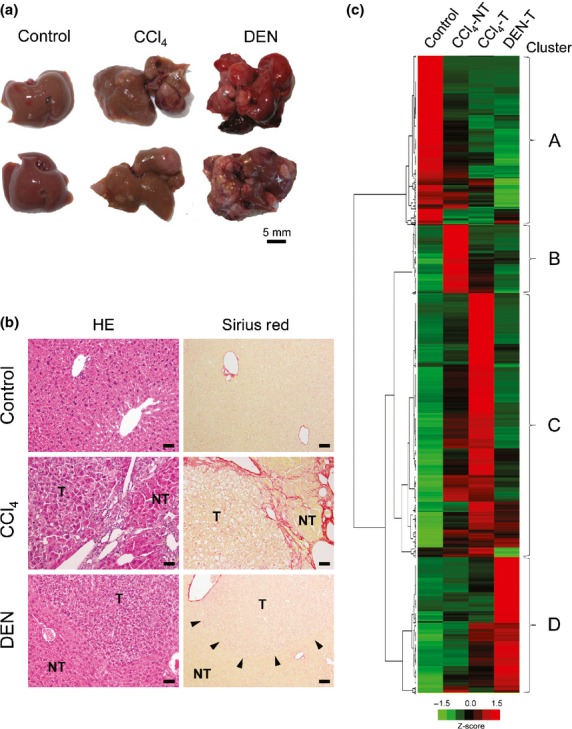
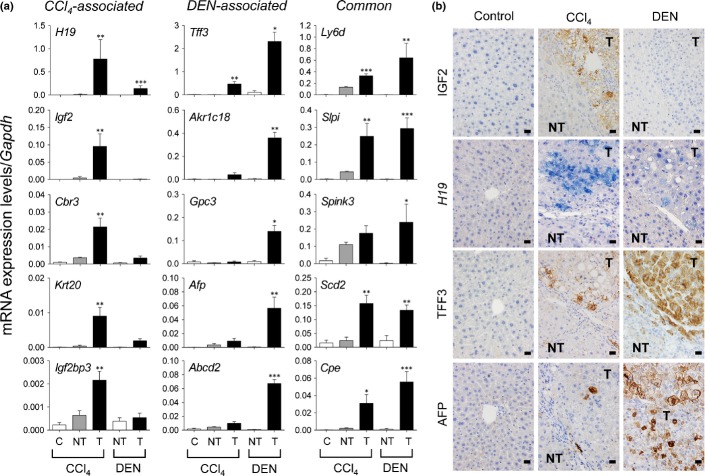
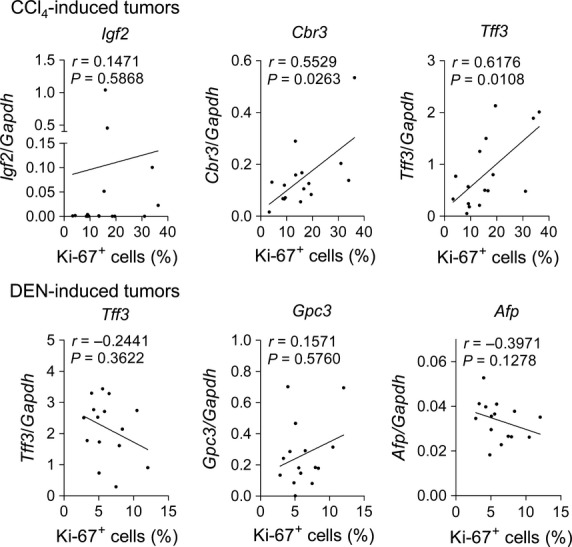
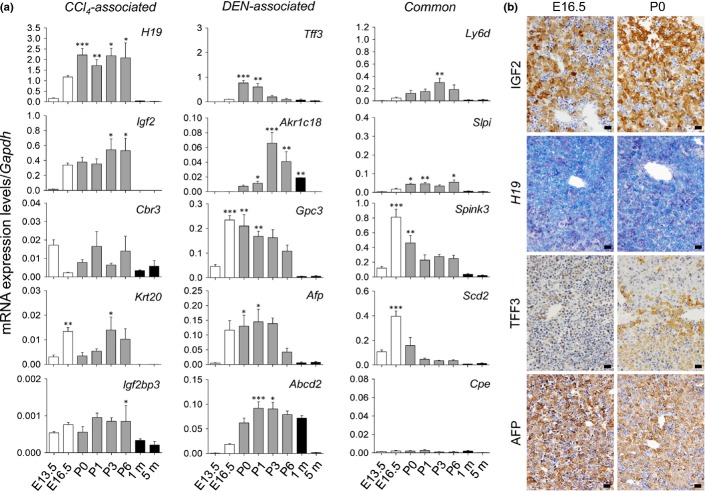
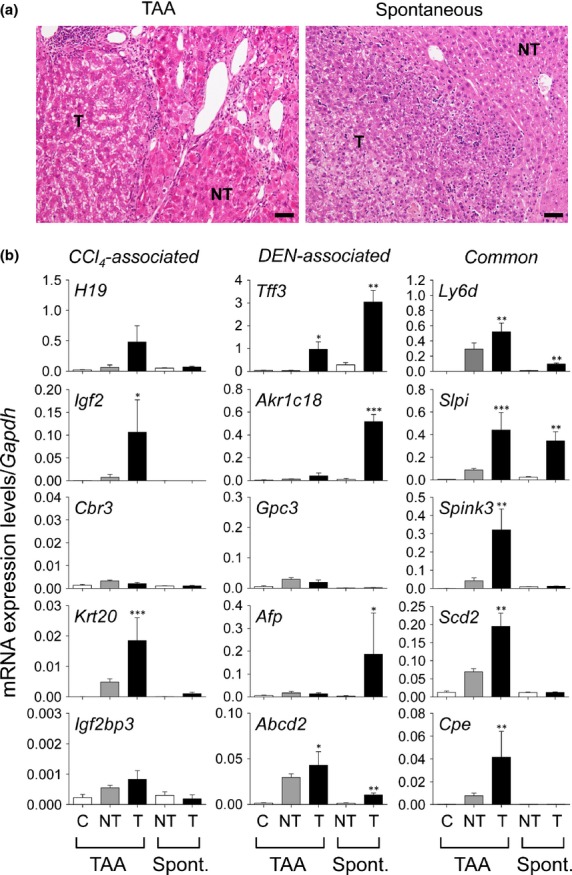
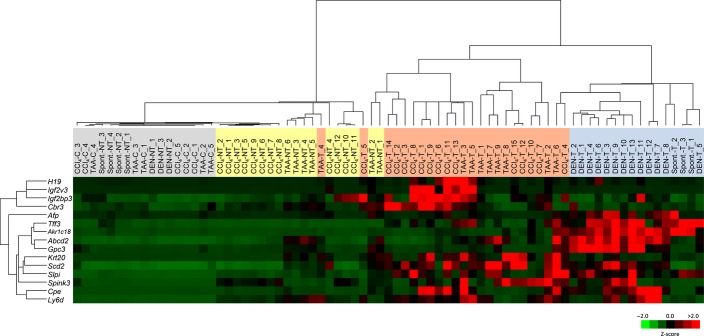
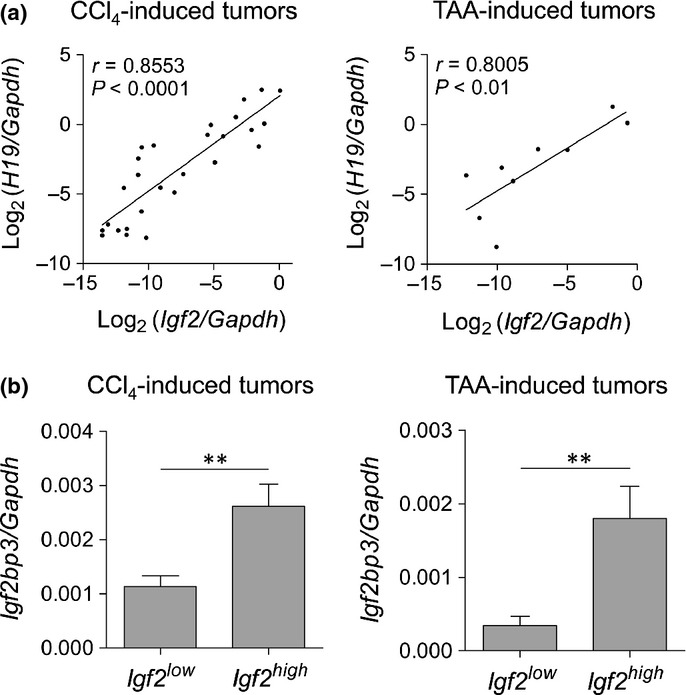
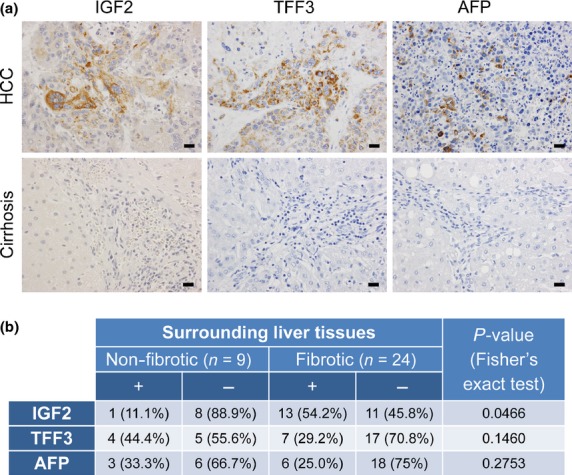
Hepatocellular carcinoma develops in either chronically injured or seemingly intact livers. To explore the tumorigenic mechanisms underlying these different conditions, we compared the mRNA expression profiles of mouse hepatocellular tumors induced by the repeated injection of CCl4 or a single diethylnitrosamine (DEN) injection using a cDNA microarray. We identified tumor-associated genes that were expressed differentially in the cirrhotic CCl4 model (H19, Igf2, Cbr3, and Krt20) and the non-cirrhotic DEN model (Tff3, Akr1c18, Gpc3, Afp, and Abcd2) as well as genes that were expressed comparably in both models (Ly6d, Slpi, Spink3, Scd2, and Cpe). The levels and patterns of mRNA expression of these genes were validated by quantitative RT-PCR analyses. Most of these genes were highly expressed in mouse livers during the fetal/neonatal periods. We also examined the mRNA expression of these genes in mouse tumors induced by thioacetamide, another cirrhotic inducer, and those that developed spontaneously in non-cirrhotic livers and found that they shared a similar expression profile as that observed in CCl4 -induced and DEN-induced tumors, respectively. There was a close relationship between the expression levels of Igf2 and H19 mRNA, which were activated in the cirrhotic models. Our results show that mouse liver tumors reactivate fetal/neonatal genes, some of which are specific to cirrhotic or non-cirrhotic modes of pathogenesis.
Keywords: Hepatocellular carcinoma; insulin-like growth factor 2; liver cirrhosis; mRNA expression; trefoil factor 3.
© 2015 The Authors. Cancer Science published by Wiley Publishing Asia Pty Ltd on behalf of Japanese Cancer Association.
Figures
Similar articles
-
Expression of glypican 3 enriches hepatocellular carcinoma development-related genes and associates with carcinogenesis in cirrhotic livers.Carcinogenesis. 2015 Feb;36(2):232-42. doi: 10.1093/carcin/bgu245. Epub 2014 Dec 25. Carcinogenesis. 2015. PMID: 25542894
-
Leptin receptor somatic mutations are frequent in HCV-infected cirrhotic liver and associated with hepatocellular carcinoma.Gastroenterology. 2014 Jan;146(1):222-32.e35. doi: 10.1053/j.gastro.2013.09.025. Epub 2013 Sep 19. Gastroenterology. 2014. PMID: 24055508
-
Expression profiling and identification of novel genes in hepatocellular carcinomas.Oncogene. 2001 May 10;20(21):2704-12. doi: 10.1038/sj.onc.1204391. Oncogene. 2001. PMID: 11420682
-
Laser microdissection for gene expression study of hepatocellular carcinomas arising in cirrhotic and non-cirrhotic livers.Methods Mol Biol. 2011;755:233-44. doi: 10.1007/978-1-61779-163-5_19. Methods Mol Biol. 2011. PMID: 21761308
-
Quantitative RT-PCR in cirrhotic nodules reveals gene expression changes associated with liver carcinogenesis.J Pathol. 2003 Oct;201(2):260-7. doi: 10.1002/path.1451. J Pathol. 2003. PMID: 14517843
Cited by
-
A lung cancer mouse model system based on an inbred C3H strain: Ultrasound imaging, pathological analysis, and proteomic biomarker identification.Vet World. 2025 May;18(5):1101-1108. doi: 10.14202/vetworld.2025.1101-1108. Epub 2025 May 12. Vet World. 2025. PMID: 40584122 Free PMC article.
-
Fatty acid binding protein 5 suppression attenuates obesity-induced hepatocellular carcinoma by promoting ferroptosis and intratumoral immune rewiring.Nat Metab. 2024 Apr;6(4):741-763. doi: 10.1038/s42255-024-01019-6. Epub 2024 Apr 25. Nat Metab. 2024. PMID: 38664583 Free PMC article.
-
Defects in mTORC1 Network and mTORC1-STAT3 Pathway Crosstalk Contributes to Non-inflammatory Hepatocellular Carcinoma.Front Cell Dev Biol. 2020 Apr 7;8:225. doi: 10.3389/fcell.2020.00225. eCollection 2020. Front Cell Dev Biol. 2020. PMID: 32363190 Free PMC article.
-
Regulatory long non-coding RNAs of hepatic stellate cells in liver fibrosis (Review).Exp Ther Med. 2021 Apr;21(4):351. doi: 10.3892/etm.2021.9782. Epub 2021 Feb 11. Exp Ther Med. 2021. PMID: 33732324 Free PMC article. Review.
-
Characterizing primary and secondary senescence in vivo.Nat Aging. 2025 Aug;5(8):1568-1588. doi: 10.1038/s43587-025-00917-y. Epub 2025 Jul 11. Nat Aging. 2025. PMID: 40646305
References
Publication types
MeSH terms
LinkOut - more resources
Full Text Sources
Other Literature Sources
Medical
Research Materials
Miscellaneous
