Comparison between 200 mg QD and 100 mg BID oral celecoxib in the treatment of knee or hip osteoarthritis
- PMID: 26012738
- PMCID: PMC4445037
- DOI: 10.1038/srep10593
Comparison between 200 mg QD and 100 mg BID oral celecoxib in the treatment of knee or hip osteoarthritis
Abstract
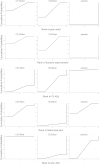
This network meta-analysis aimed to investigate the effectiveness and safety of 100 mg BID and 200 mg QD oral celecoxib in the treatment of OA of the knee or hip. PubMed, Embase and Cochrane Library were searched through from inception to August 2014. Bayesian network meta-analysis was used to combine direct and indirect evidences on treatment effectiveness and safety. A total of 24 RCTs covering 11696 patients were included. For the comparison in between the two dosage regimens, 100 mg BID oral celecoxib exhibited a greater probability to be the preferred one either in terms of pain intensity or function at the last follow-up time point. For total gastrointestinal (GI) adverse effects (AEs), both of the two dosage regimens demonstrated a higher incidence compared to the placebo group. Further analyses of GI AEs revealed that only 200 mg QD was associated with a significantly higher risk of abdominal pain when compared with placebo. Furthermore, 100 mg BID showed a significantly lower incidence of skin AEs when compared with 200 mg QD and placebo. Maybe 100 mg BID should be considered as the preferred dosage regimen in the treatment of knee or hip OA.
Figures


References
-
- Dieppe P. A. & Lohmander L. S. Pathogenesis and management of pain in osteoarthritis. Lancet. 365, 965–973 (2005). - PubMed
-
- Lawrence R. C. et al. Estimates of the prevalence of arthritis and selected musculoskeletal disorders in the United States. Arthritis Rheum. 41, 778–799 (1998). - PubMed
-
- McAlindon T. E. et al. OARSI guidelines for the non-surgical management of knee osteoarthritis. Osteoarthritis Cartilage 22, 363–388 (2014). - PubMed
-
- Brown G. A. AAOS clinical practice guideline: treatment of osteoarthritis of the knee: evidence-based guideline, 2nd edition. J. Am. Acad. Orthop. Surg. 21, 577–579 (2013). - PubMed
-
- Zarraga I. G. E. & Schwarz E. R. Coxibs and heart disease: what we have learned and what else we need to know. J. Am. Coll. Cardiol. 49, 1–14 (2007). - PubMed
Publication types
MeSH terms
Substances
LinkOut - more resources
Full Text Sources
Other Literature Sources

