. 2016 Jan;25(1):87-102.
doi: 10.1002/pro.2713. Epub 2015 Jun 11.

Molecular dynamics simulation of triclinic lysozyme in a crystal lattice

Affiliations

Molecular dynamics simulation of triclinic lysozyme in a crystal lattice

Pawel A Janowski et al. Protein Sci. 2016 Jan.

Abstract

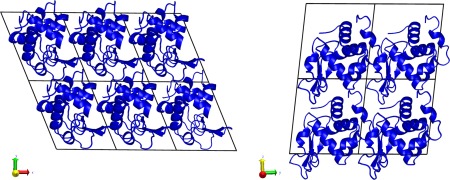
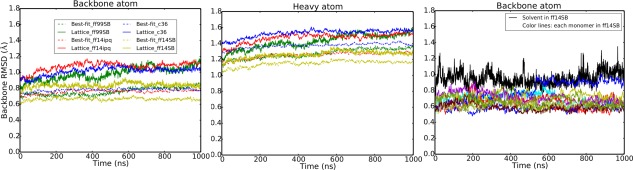
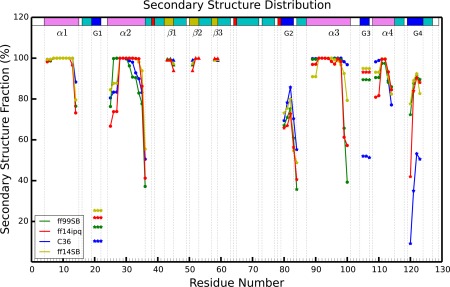
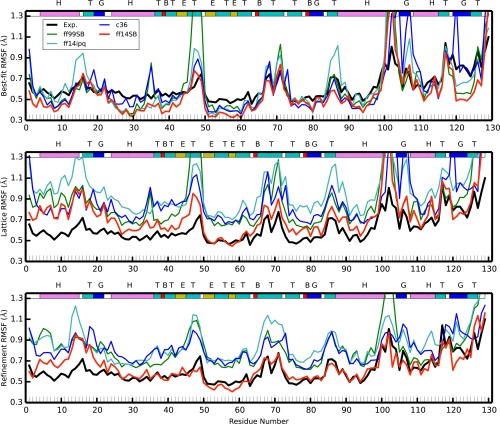
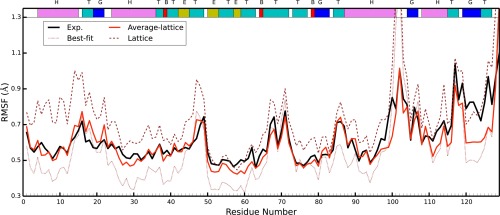
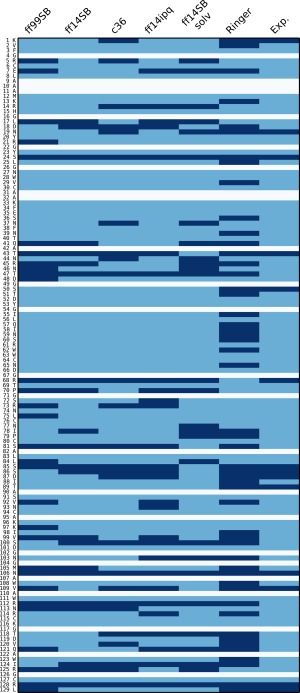
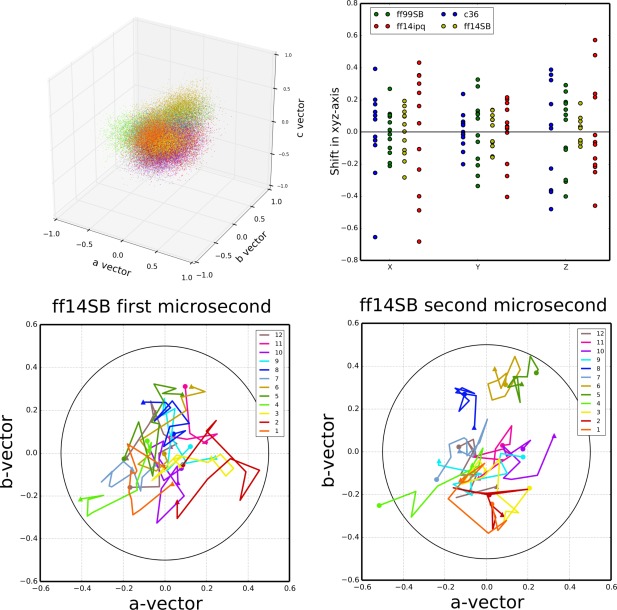
Molecular dynamics simulations of crystals can enlighten interpretation of experimental X-ray crystallography data and elucidate structural dynamics and heterogeneity in biomolecular crystals. Furthermore, because of the direct comparison against experimental data, they can inform assessment of molecular dynamics methods and force fields. We present microsecond scale results for triclinic hen egg-white lysozyme in a supercell consisting of 12 independent unit cells using four contemporary force fields (Amber ff99SB, ff14ipq, ff14SB, and CHARMM 36) in crystalline and solvated states (for ff14SB only). We find the crystal simulations consistent across multiple runs of the same force field and robust to various solvent equilibration schemes. However, convergence is slow compared with solvent simulations. All the tested force fields reproduce experimental structural and dynamic properties well, but Amber ff14SB maintains structure and reproduces fluctuations closest to the experimental model: its average backbone structure differs from the deposited structure by 0.37Å; by contrast, the average backbone structure in solution differs from the deposited by 0.65Å. All the simulations are affected by a small progressive deterioration of the crystal lattice, presumably due to imperfect modeling of hydrogen bonding and other crystal contact interactions; this artifact is smallest in ff14SB, with average lattice positions deviating by 0.20Å from ideal. Side-chain disorder is surprisingly low with fewer than 30% of the nonglycine or alanine residues exhibiting significantly populated alternate rotamers. Our results provide helpful insight into the methodology of biomolecular crystal simulations and indicate directions for future work to obtain more accurate energy models for molecular dynamics.

Keywords: biomolecular crystallography; computational crystallography; crystal simulations; force fields; lysozyme; molecular dynamics.


Figures

Figure 1
Figure 1
Simulation setup of the HEWL supercell. The P1 space group unit cell was extended three times along the crystallographic a axis and two times each along the b and c axes. Addition of solvent is described in Table I.
Figure 2
Figure 2
RMSD for four different force field simulations and comparison with solution simulation. Left hand panel shows backbone atom RMSD; middle panel shows all heavy atom RMSD. Dotted lines show best‐fit and solid lines show lattice RMSD (see text and Ref. 17 for more details). Black line in right panel represents the best‐fit backbone RMSD of the liquid state simulation (ff14SB_solv). Colored lines show the best‐fit backbone RMSD of each monomer in the ff14SB crystal simulation. The final 1000 ns of each simulation are shown (first 160–180 ns of each simulation were discarded to allow the systems to equilibrate).
Figure 3
Figure 3
Comparison of secondary structure elements during each of four different force field simulations. Residue numbers are on the x‐axis and percentage of simulation time spent in a particular type of secondary structure is on the y‐axis. Each simulation is represented by a different color and each type of secondary structure is shown by a different geometric figure (α, β, and G are alpha helix, beta sheet, 310 helix, respectively).
Figure 4
Figure 4
Best‐fit (top) and lattice (middle) and refined (bottom) Cα carbon RMSF for the four crystal simulations and compared with experiment. Colored lines correspond to each of the four simulations (red: ff14SB, blue: C36, cyan: ff14ipq, green: ff99SB); black shows the experimental results. The colored band across the top describes the secondary structure (T: turn, E: β‐sheet, H: α‐helix, G:310 helix, B:isolated bridge).
Figure 5
Figure 5
The averaged lattice fluctuations from each individual monomer in the ff14SB simulation (shown in red). Lattice RMSF were calculated for each of the 12 monomers and then averaged. Experimental results are shown in black. The best‐fit (brown dots) and lattice(brown dashes) fluctuations are those of ff14SB found in Figure 4 and are shown here for reference.
Figure 6
Figure 6
χ 1 angle side chain disorder in each of the simulations. In each simulation (first five columns), each residue (rows) is classified as either multimeric (dark blue) or nonmultimeric (light blue). White rows indicate alanine or glycine residues. See text for explanation on the classification method. For the Ringer column, dark blue means Ringer predicted more than one χ 1 rotamer, light blue if Ringer predicted only one. Experimental column is dark blue if the side chain was modeled with an alternate conformer in the 4LZT deposition, light blue otherwise.
Figure 7
Figure 7
ASU center of mass movement relative to ideal crystal lattice positions. Upper‐left: cumulative plot of the center of mass of each ASU relative to the ideal lattice position at each time point in the simulation. Points are colored by each independent copy of the ASU in the system (12 independent ASUs). ff14SB is shown, data for the other simulations can be found in the Supporting Information. Upper‐right: mean distance of each independent ASU relative to the ideal crystal position along each of the crystal system axes (a–c). Lower‐left: mean position of each ASUs center of mass plotted over intervals of 100 ns over the course of the first microsecond of simulation. Starting position (<t = 0–100 ns>) indicated by a circle and ending position (<t = 900–1000 ns>) indicated by a triangle. Data shown for the ff14SB simulation; similar plots for the other simulations available in the Supporting Information. Lower‐right: similar plot for the second microsecond of the ff14SB simulation. A circle is drawn at 0.5 Å from the ideal center of mass in both plots.

References

    1. Henzler‐Wildman K, Kern D (2007) Dynamic personalities of proteins. Nature 450:964–972. - PubMed
    1. Kern D, Zuiderweg ER (2003) The role of dynamics in allosteric regulation. Curr Opin Struct Biol 13:748–757. - PubMed
    1. Tsai C‐J, Del Sol A, Nussinov R (2009) Protein allostery, signal transmission and dynamics: a classification scheme of allosteric mechanisms. Mol Biosyst 5:207–216. - PMC - PubMed
    1. Frederick KK, Marlow MS, Valentine KG, Wand AJ (2007) Conformational entropy in molecular recognition by proteins. Nature 448:325–329. - PMC - PubMed
    1. Schmidt A, Lamzin VS (2005) Extraction of functional motion in trypsin crystal structures. Acta Crystallogr D 61:1132–1139. - PubMed

Publication types

LinkOut - more resources