. 2015 May 27:5:10531.
doi: 10.1038/srep10531.

Three-dimensional cage-like microscaffolds for cell invasion studies

Affiliations

Three-dimensional cage-like microscaffolds for cell invasion studies

Barbara Spagnolo et al. Sci Rep. .

Abstract

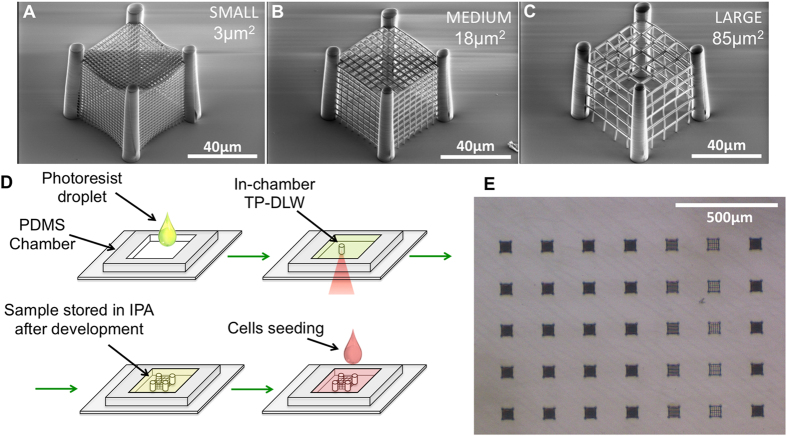
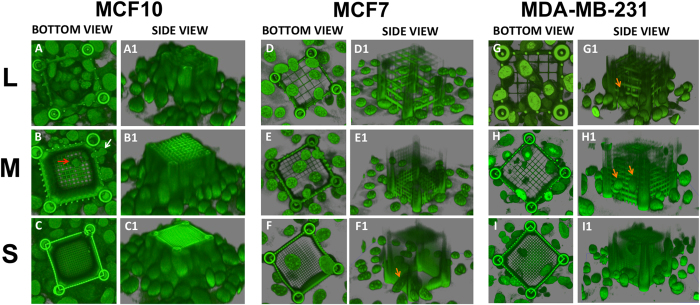
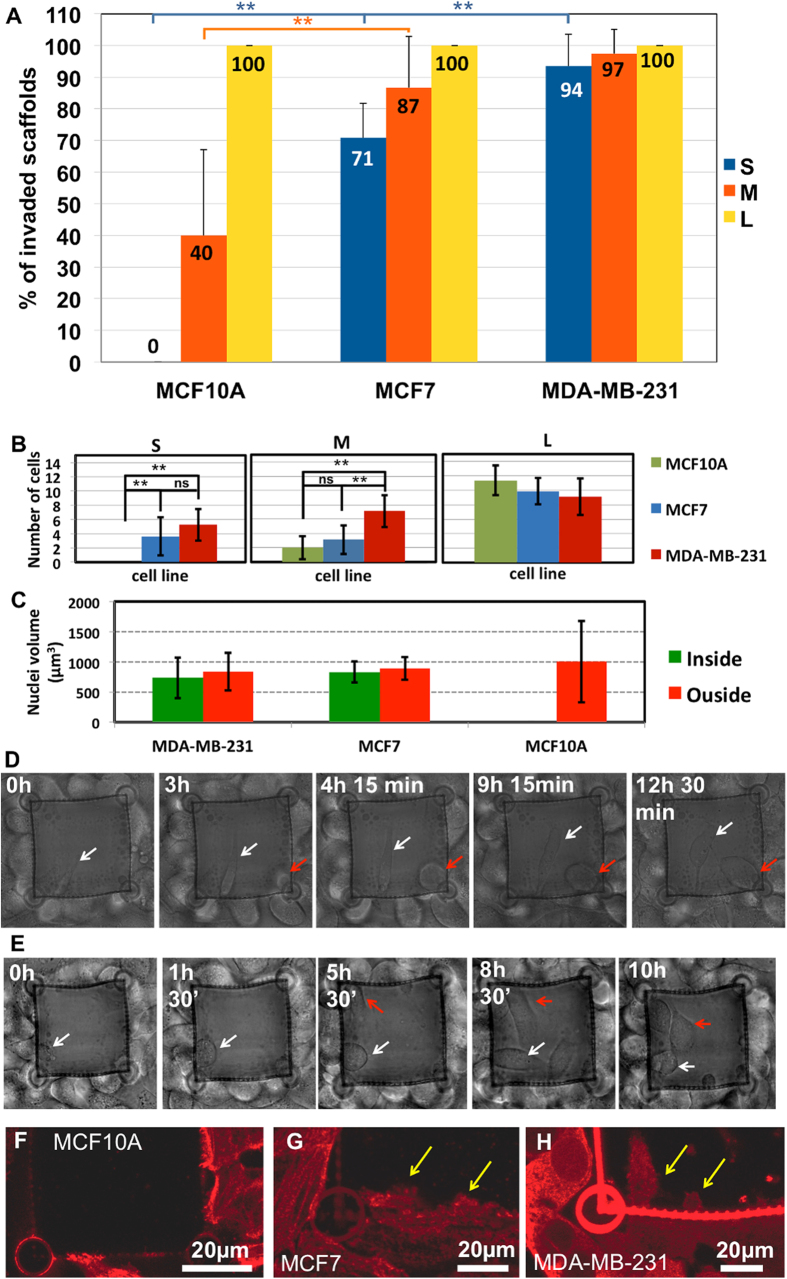
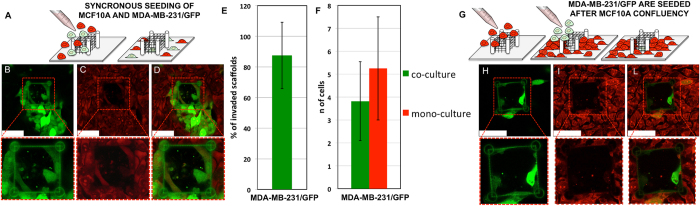
Cancer cell motility is one of the major events involved in metastatic process. Tumor cells that disseminate from a primary tumor can migrate into the vascular system and, being carried by the bloodstream, transmigrate across the endothelium, giving rise to a new tumor site. However, during the invasive process, tumor cells must pass through the extracellular matrix, whose structural and mechanical properties define the parameters of the migration process. Here, we propose 3D-complex cage-like microstructures, realized by two-photon (TP) direct laser writing (DLW), to analyze cell migration through pores significantly smaller than the cell nucleus. We found that the ability to traverse differently sized pores depends on the metastatic potential and on the invasiveness of the cell lines, allowing to establish a pore-area threshold value able to discriminate between non-tumorigenic and tumorigenic human breast cells.


Figures

Figure 1
Figure 1. Cyanamide biosynthesis from L-canavanine.
Panels (A–C) SEM bird eye views of cage-like structures having ~3, 18, and 85 μm2 pore-area. Panel (D) Steps of the fabrication process. From left to right and from top to bottom: (i) a drop of IP-L photoresist is dropcasted into a PDMS chamber previously glued on a glass microscope coverslip, (ii) the resist is exposed by means of TP-DLW, (iii) sample is developed and stored in IPA and (iv) cells are seeded within the chamber. All realized cages were kept in liquid ambient to avoid any deformation induced by solvent evaporation, apart for the samples used for SEM inspection. (Panel E) Representative optical microscope image of a sample after development.
Figure 2
Figure 2. 3D Confocal reconstructions of representative cage-cell interactions for each pore size.
Panels (A–C) were obtained for MCF10A cell line, Panels (D–F) for MCF7 and Panels (G–I) for MDA-MB-231. All images were obtained after DAPI staining on fixed culture in PBS. All images are in false colour and microsctructures have a broad emission spectrum. Their luminescence can be collected together with the one of DAPI stained cell nuclei, in the range [420 nm, 500 nm].
Figure 3
Figure 3. Invasiveness evaluation.
Panel (A) Histogram of the percentage of invaded scaffold for each pore area and cell line. The number of cages used to draw the histogram for S-size cage was n = 25, n = 38 and n = 28 for MCF10A, MCF7 and MDA-MB-231, respectively. In case of M-size cage, it was n = 16, n = 18 and n = 27 for MCF10A, MCF7 and MDA-MB-231, respectively. For L-size cage, it was n = 32, n = 23, and n = 25 for MCF10A, MCF7 and MDA-MB-231, respectively. * p < 0.05, ** p < 0.025 and ns p > 0.05, error bars indicate standard deviation. Panel (B) Histogram of the average number of cells inside invaded scaffolds. n = 8 for each histogram line. * p < 0.05, ** p < 0.025 and ns p > 0.05, error bars are standard deviations. Panel (C) Histogram of the average nuclear volume per cell line evaluated on confocal z-stack images of S-sized pore cages. Volumes were evaluated on n = 10 cells inside the cages and n = 10 cells outside the cages for MCF7 and MDA-MB-231 and n = 20 for MCF10A. Error bars indicate standard deviation. Panels (D–E) Representative frames of the time-lapse experiments with MDA-MB-231 and S-size cages (the corresponding movies are reported as Supplementary Movie 1 and 2, respectively). Red arrows indicate cells entering into the cage by exploiting one of the pillars, while white arrows indicate cells passing through the single pore without interacting with any of the pillars. Panels (F–H) Confocal microscope images of the three cell lines interacting with S-sized cages for MCF10A, MCF7 and MDA-MB-231, respectively. Fluorescence is obtained through immunostaining of myosin IIA as detailed in experimental section.
Figure 4
Figure 4. Co-culture experiments.
Panel (A) Schematic representation of the adopted synchronous seeding procedure, in which MCF10A and MDA-MB-231/GFP were seeded at the same time. Panels (B, C) Representative fluorescence confocal images of the S-size cages after the procedure schematized in panel (A) and after sample fixation and cell staining with Propidium Iodide. Panel B was acquired at green wavelengths, thus detecting signal only from MDA-MB-231/GFP, while panel C was acquired at red wavelengths, thus detecting signal from both cell lines. Panel (D) is the overlap between panels C and D. Panel (E) Percentage of invaded cages after 96 h of co-seeded MCF10A and MDA-MB-231/GFP at 10:1 concentration with the protocol displayed in panel A. Data are evaluated on three independent experiments and on a total of n = 15 S-cages. Error bar represents standard deviation. Panel (F) Average Number of MDA-MB-231/GFP inside S-sized cages after 96 h in co- and mono-cultures. Histogram shows the average number of cells invading a single cage in mono-culture (n = 10, red) and co-culture (n = 8, green) experiments. Error bars are standard deviation. Panel (G) Schematic representation of the adopted asynchronous seeding procedure, in which MDA-MB-231/GFP were seeded after 6 days of MCF10A culture, once confluency was obtained. Panels (H, I) Representative fluorescence confocal images of the S-size cages after the procedure schematized in panel G and after sample fixation and staining with Propidium. Panel H was acquired at green wavelengths, thus detecting signal only from MDA-MB-231/GFP, while panel G was acquired at red wavelengths, thus detecting signal from both cell lines. Panel (L) is the overlap between panels H and I. Scalebars in panels B-D, H-L represent 50 μm.
Figure 5
Figure 5. Confocal images of MCF10A, MCF7 and MDA-MB-231 cell lines stained for non-muscle myosin IIA light chain detection.
Panel (A): myosin localization in MCF10A cells entering in a M-sized cage-like structure. Panels (B), (C): myosin aggregates at the cell-cage interface for S pores. Panel (D): cortical myosin distribution of myosin IIA and small multiple myosin-rich invadopodia in MCF7 cells. Panels (E), (F): elongated myosin filaments and aggregates in MCF7 interacting with S pores. Panels (G–I): myosin distribution in MDA-MB-231/GFP cells interacting with a S-sized cage. In panel G a diffused myosin immunostaining is predominant. Panels H and I show small myosin aggregates in correspondence to invadopodia focal points. Panels (L–N): myosin IIA distribution in non-confluent samples. Scale bars represent 10 μm in panels A, B, D, E. G, H, L, M, and N, and 5 μm in panels C, F, I.

References

    1. Bailly M. & Condeelis J. Cell motility: insights from the backstage. Nat. Cell. Bio 4, E292–E294 (2002). - PubMed
    1. Petrie R. J., Doyle A. D. & Yamada K. M. Random versus directionally persistent cell migration. Nat. Rev. Mol. Cell. Bio. 10, 538–549 (2009). - PMC - PubMed
    1. Vergani L., Grattarola M. & Nicolini C. Modifications of chromatin structure and gene expression following induced alterations of cellular shape. Int. J. Biochem. Cell. B. 36, 1447–1461 (2004). - PubMed
    1. Dahl K. N., Kahn S. M., Wilson K. L. & Discher D. E. The nuclear envelope lamina network has elasticity and a compressibility limit suggestive of a molecular shock absorber. J. Cell. Sci. 117, 4779–4786 (2004). - PubMed
    1. Versaevel M., Grevesse T. & Gabriele S. Spatial coordination between cell and nuclear shape within micropatterned endothelial cells. Nat. Comm. 3, 671 (2012). - PubMed

Publication types

Substances