. 2015 May 27:5:10423.
doi: 10.1038/srep10423.

Unique somatic and malignant expression patterns implicate PIWI-interacting RNAs in cancer-type specific biology

Affiliations

Unique somatic and malignant expression patterns implicate PIWI-interacting RNAs in cancer-type specific biology

Victor D Martinez et al. Sci Rep. .

Abstract

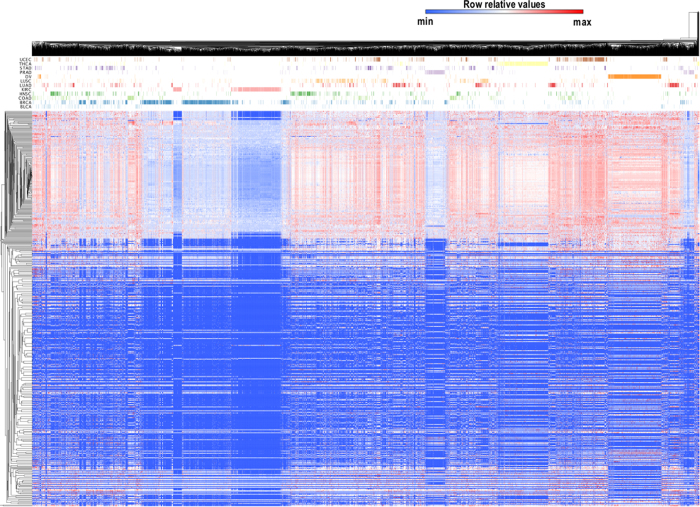
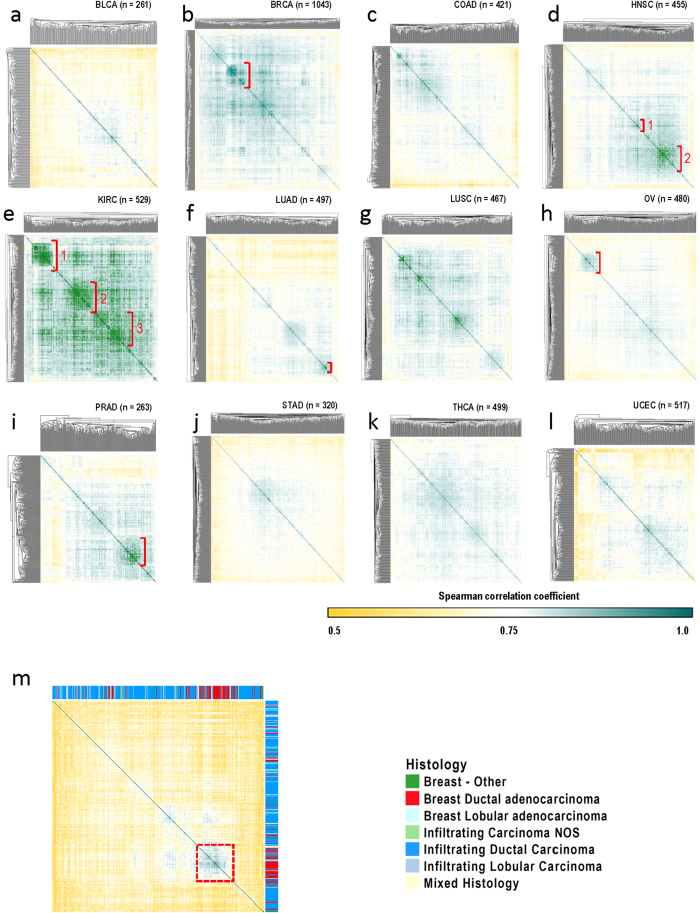
Human PIWI-interacting RNAs (piRNAs) are known to be expressed in germline cells, functionally silencing LINEs and SINEs. Their expression patterns in somatic tissues are largely uncharted. We analyzed 6,260 human piRNA transcriptomes derived from non-malignant and tumour tissues from 11 organs. We discovered that only 273 of the 20,831 known piRNAs are expressed in somatic non-malignant tissues. However, expression patterns of these piRNAs were able to distinguish tissue-of-origin. A total of 522 piRNAs are expressed in corresponding tumour tissues, largely distinguishing tumour from non-malignant tissues in a cancer-type specific manner. Most expressed piRNAs mapped to known transcripts, contrary to "piRNA clusters" reported in germline cells. We showed that piRNA expression can delineate clinical features, such as histological subgroups, disease stages, and survival. PiRNAs common to many cancer types might represent a core gene-set that facilitates cancer growth, while piRNAs unique to individual cancer types likely contribute to cancer-specific biology.


Figures

Figure 1
Figure 1. Genome-wide distribution of piRNA expression in human non-malignant tissues.
Colour coding for somatic tissues noted in Fig. 1A applies to all panels (a–c). a) Unsupervised hierarchical clustering of rank-normalized piRNA expression levels from 508 non-malignant tissue samples derived from 10 different organs: bladder, breast, colon, head and neck, kidney, lung, prostate, stomach, thyroid and uterine corpus. Tissue types are colour coded and separated by rows under the dendrogram. A total of 273 piRNAs were expressed in non-malignant tissues. Expression levels are coded from low (blue) to high (red) on a row-standardized scale, meaning that expression values (colours) are comparable both across rows. The single colon non-malignant sample analyzed is not shown in this heatmap, to avoid misinterpretation due to a low sample size b) Top three differentially expressed piRNAs that can discriminate between thyroid and other tissues based on a comparative marker selection analysis. Unsupervised hierarchical clustering was also performed to display the ability to distinguish thyroid (yellow) from other tissues. c) Box-and-whiskers plots of normalized expression levels of FR069557 across different non-malignant tissue types.
Figure 2
Figure 2. piRNA expression in non-malignant and tumour tissues.
Expression patterns across all non-malignant (top row green, n = 508) and tumour tissues (top row red, n = 5,752). The second row indicates source of tissue. Each row in the heatmap denotes the rank-normalized RPKM levels of each of the piRNAs expressed across non-malignant and tumour tissues, in a row-standardized scale. PiRNA expression is clustered according to expression levels. Dark blue represents low expression levels, red denotes higher expression of a given piRNA.
Figure 3
Figure 3. piRNA expression patterns differentiate between normal and tumour tissues.
Unsupervised hierarchical clustering (average linkage, Euclidean distance) analysis on rank normalized expression values in non-malignant (NM, green) and tumour (T, red) samples derived from the following tissues: bladder (BLCA, NM = 19, T = 260), breast (BRCA, NM = 103, T = 1,043), head and neck (HNSC, NM = 43, T = 455), kidney renal clear cell (KIRC, NM = 71, T = 529), lung adenocarcinoma (LUAD, NM = 46, T = 497), lung squamous cell (LUSC, NM = 45, T = 469), prostate (PRAD, NM = 50, T = 263), stomach (STAD, NM = 38, T = 320), thyroid (THCA, NM = 59, T = 499), and uterine corpus (UCEC, NM = 33, T = 518). COAD and OV were excluded from this analysis because they had one and zero samples derived from normal tissue, respectively.
Figure 4
Figure 4. Genome-wide expression of piRNA
a) Circular representation of genome-wide expression of piRNAs in 5,752 tumour samples derived from 12 different tissues. An ideogram of human chromosomes is shown in the outer ring, with chromosomes coloured in the same manner than the innermost ring, where the name of the expressed piRNAs are shown considering their chromosome location. Each concentric track between the two ideograms represents a histogram of average RPKM piRNA expression for each tumour type minus the expression of the same piRNA observed in non-malignant tissue (if expressed). Thus, the figure represents tumour-specific expression. The darker line on each track represents an average RPKM value = 0. Bars above this line represent that the expression of a given piRNA is higher in tumours, while bars below correspond to piRNA expressed at higher levels in non-malignant tissue compared to tumours. b) Detailed view of mt-piRNA expression across tumour types. Rank-normalized expression of the five most highly expressed piRNAs is shown.
Figure 5
Figure 5. Unsupervised clustering of piRNA expression in tumour tissues.
An unsupervised hierarchical clustering (average linkage, Euclidean distance) of piRNA expression profiles was performed on tumour samples derived from all analyzed tissues. Tumour types are colour-coded and separated by rows under the dendrogram. Rank-normalized expression values are expressed on an row-standardized scale and range from low (dark blue) to high (red) expression.
Figure 6
Figure 6. Correlation of piRNA expression patterns across samples within the same tumour type. a–l)
Spearman correlation-based matrices for each tumour type. a) BLCA, b) BRCA, c) COAD, d) HNSC, e) KIRC, f) LUAD, g) LUSC, h) OV, i) PRAD, j) STAD, k) THCA, and l) UCEC. Darker green boxes indicate a higher correlation among samples, while yellow indicates a poorer correlation. Red brackets indicate clusters of highly related samples that were selected for correlative analyses with clinical variables. m) Spearman correlation-based matrix for 415 breast tumour samples with available histology information. A cluster of highly correlated samples (dashed red square) is significantly enriched (p value <0.0001, Fisher Exact Test) for breast ductal adenocarcinoma histology.
Figure 7
Figure 7. piRNA-based survival analysis.
We assessed the association of piRNA expression with cancer patient survival using a logrank test. We considered the 522 piRNAs exclusively expressed in tumours in 4,976 samples where survival information was available (12 tumour types). Survival associations were only calculated for piRNAs that were detectably expressed in at least two-thirds of the samples for each particular cancer type. Patient outcome was compared in patients with piRNA expression levels ranking in the top and bottom tertiles of expression.

References

    1. van Wolfswinkel J. C. & Ketting R. F. The role of small non-coding RNAs in genome stability and chromatin organization. J. Cell Sci. 123, 1825–1839, 10.1242/jcs.061713 (2010). - DOI - PubMed
    1. Gunawardane L. S. et al. A slicer-mediated mechanism for repeat-associated siRNA 5′ end formation in Drosophila. Science 315, 1587–1590, 10.1126/science.1140494 (2007). - DOI - PubMed
    1. Wilson R. C. & Doudna J. A. Molecular mechanisms of RNA interference. Annu. Rev. Biophys. 42, 217–239, 10.1146/annurev-biophys-083012-130404 (2013). - DOI - PMC - PubMed
    1. Grivna S. T., Beyret E., Wang Z. & Lin H. A novel class of small RNAs in mouse spermatogenic cells. Genes. Dev. 20, 1709–1714, 10.1101/gad.1434406 (2006). - DOI - PMC - PubMed
    1. Watanabe T. et al. Identification and characterization of two novel classes of small RNAs in the mouse germline: retrotransposon-derived siRNAs in oocytes and germline small RNAs in testes. Genes. Dev. 20, 1732–1743, 10.1101/gad.1425706 (2006). - DOI - PMC - PubMed

Publication types