. 2015 Jul 10;6(19):17206-20.
doi: 10.18632/oncotarget.4043.

YAP is a critical oncogene in human cholangiocarcinoma

Affiliations

YAP is a critical oncogene in human cholangiocarcinoma

Tiemin Pei et al. Oncotarget. .

Abstract

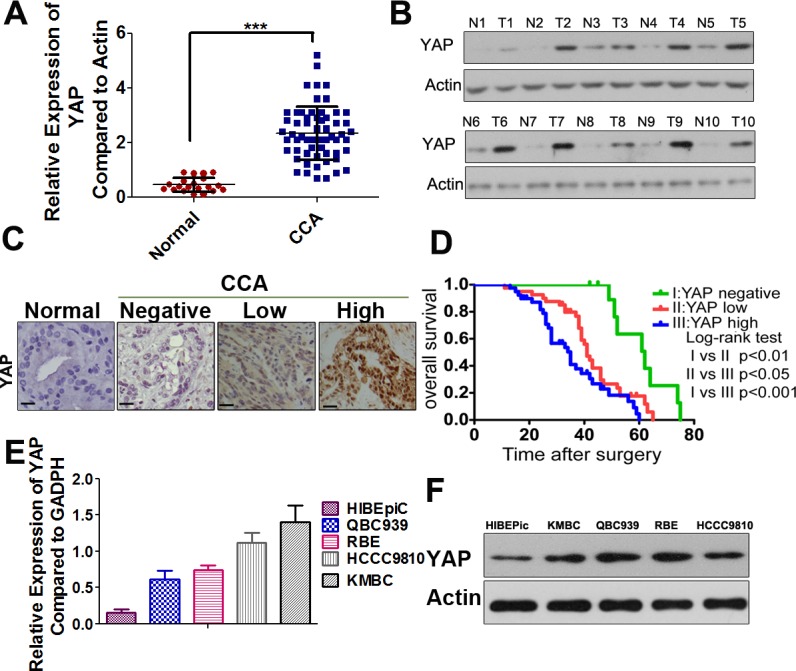
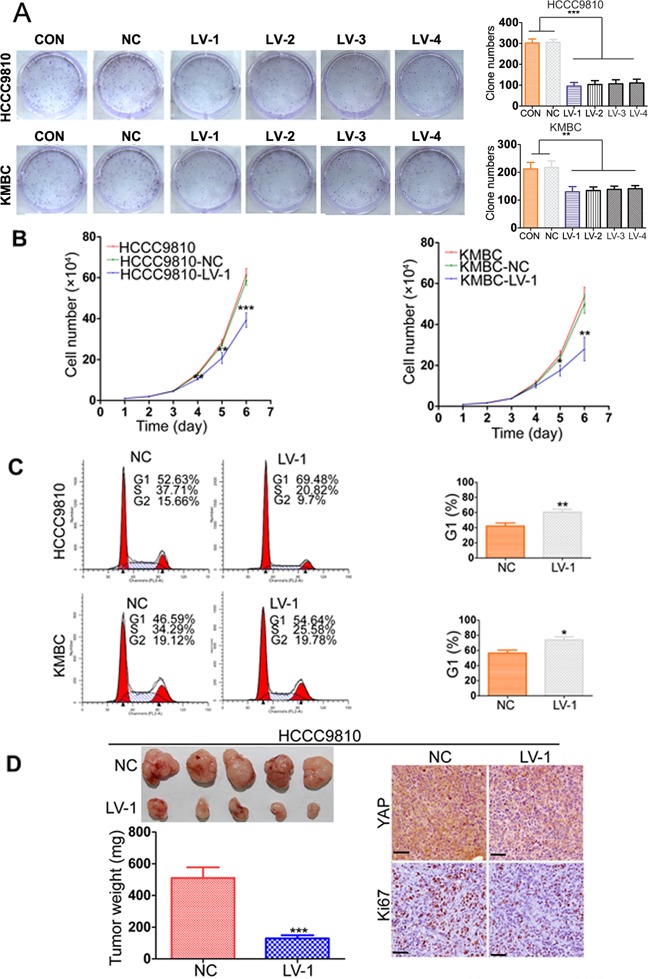
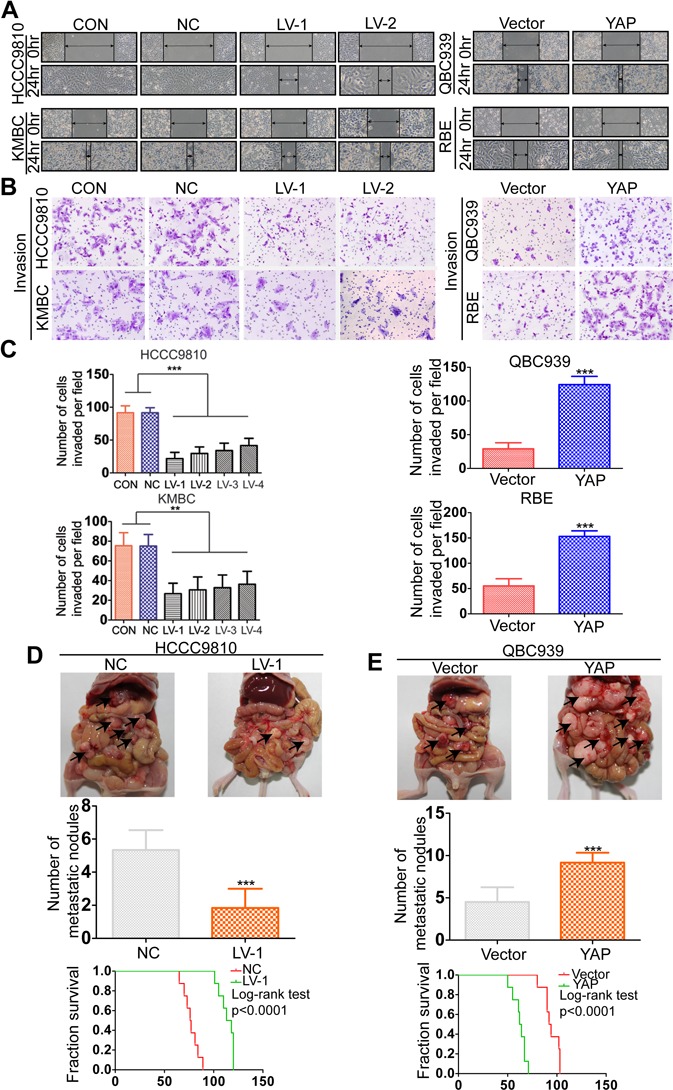
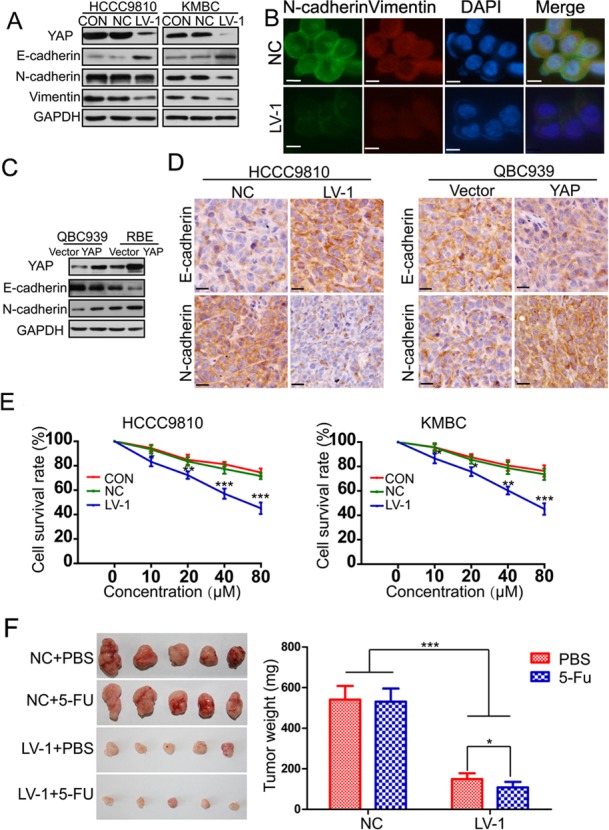
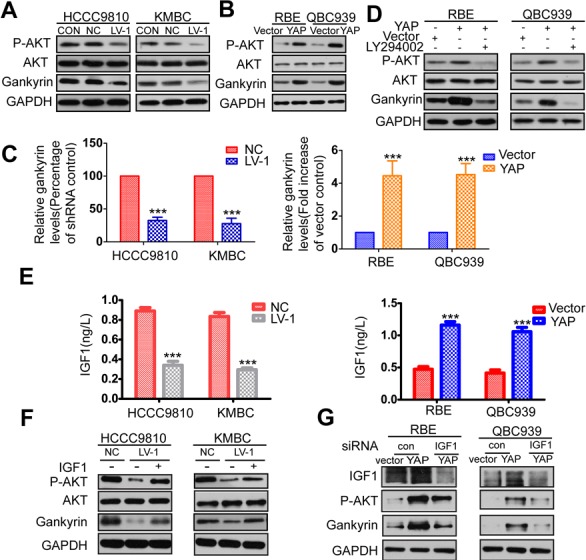
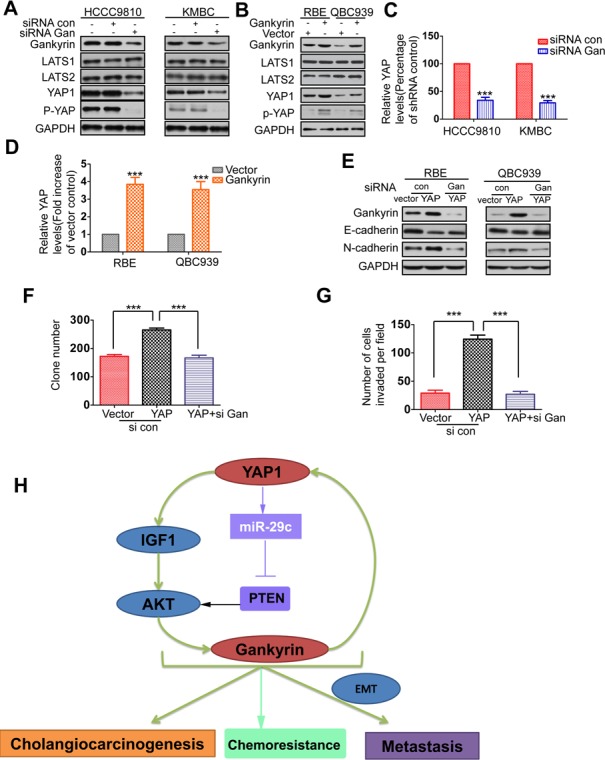
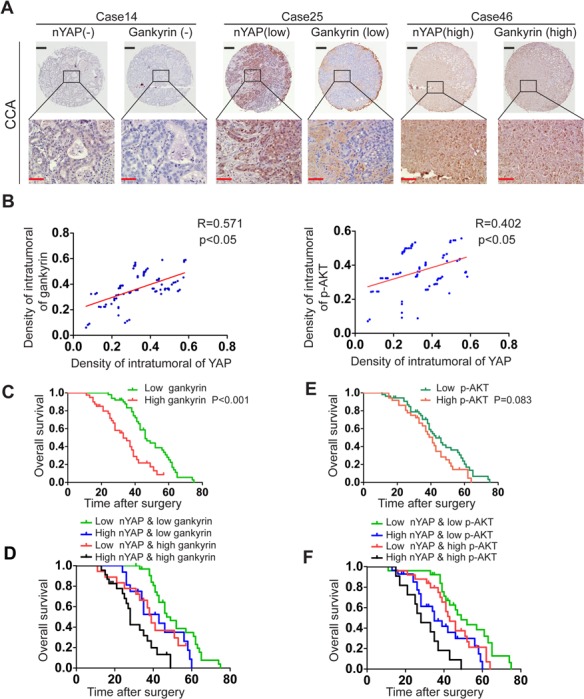
Yes-associated protein (YAP), a transcriptional co-activator, has important regulatory roles in cell signaling and is dysregulated in a number of cancers. However, the role of YAP in cholangiocarcinoma (CCA) progression remains unclear. Here, we demonstrated that YAP was overexpressed in CCA cells and human specimens. High levels of nuclear YAP (nYAP) correlated with histological differentiation, TNM stage, metastasis and poor prognosis in CCA. Silencing YAP increased tumor sensitivity to chemotherapy and inhibited CCA tumorigenesis and metastasis both in vivo and in vitro. YAP overexpression in vivo and in vitro promoted CCA tumorigenesis and metastasis. Additionally, we found that YAP induced epithelial-mesenchymal transition (EMT) and formed a regulatory circuit with miR-29c, IGF1, AKT and gankyrin to promote the progression of CCA. Results of CCA tissue microarray showed positive correlations between nYAP and gankyrin or p-AKT expression. Combination of nYAP and gankyrin or p-AKT exhibited improved prognostic accuracy for CCA patients. In conclusion, YAP promotes carcinogenesis and metastasis by up-regulating gankyrin through activation of the AKT pathway.

Keywords: AKT; YAP; cholangiocarcinoma; gankyrin; tumorigenesis.


Conflict of interest statement

DISCLOSURE OF POTENTIAL CONFLICTS OF INTEREST

The authors declare no conflicts of interest.

Figures

Figure 1
Figure 1. YAP is highly expressed in CCAs and predicts a poor prognosis
A. YAP mRNA levels were significantly increased in a large percentage of human CCA tissues compared with normal bile duct tissues determined by qRT-PCR. ***, P < 0.001. B. Representative images of Western-blot assays in a subset of fresh frozen tissues confirmed the overexpression of YAP in human CCAs compared with normal tissues. T: tumors; N: normal tissues. C. Representative IHC staining of YAP in normal bile duct sample, YAP-negative (N: no positive YAP staining), YAP-low (L: below the median value of the integrated optical density) and YAP-high (H: above the median value of the integrated optical density) CCA samples were shown, black scale bar stands for 25 μm. D. The Kaplan-Meier method was used to determine the survival of 90 patients with CCA and log-rank test to compare survival among the YAP-negative, YAP-low and YAP-high groups. E. Relative YAP mRNA expression levels in HIBEpiC and CCA cell lines by qRT-PCR. F. Western blotting analysis of YAP in HIBEpiC and four CCA cell lines were performed. Actin was used as internal control.
Figure 2
Figure 2. YAP knockdown inhibits CCA tumor growth both in vitro and in vivo
A. Representative images of foci formation assays were shown in the left panels; the number of foci was counted as shown in the right panels. B. Growth curves for the indicated CCA cells (CON, NC, LV-1) were measured by direct cell counting. C. The cell cycle distribution of HCCC9810 and KMBC (NC and LV-1) cells were analyzed (left panel). Silencing YAP induced G1 cell cycle arrest (right panel). D. YAP knockdown reduced HCCC9810 cell xenograft tumor growth in nude mice. YAP and Ki-67 expression were examined by IHC staining. Scale bar stands for 25μm. CON, control group without any infection; NC, infected with negative lentivirus; LV, infected with Lenti-shRNA YAP. Experiments were done three times and data are presented as mean±SD. *P < 0.05; **P < 0.01; ***P < 0.001.
Figure 3
Figure 3. YAP promotes CCA metastasis both in vitro and in vivo
A. Wound-healing assay showed that overexpressing YAP promoted CCA cells migration, whereas silencing YAP inhibited migration. Representative images were taken at 0 and 48 hours after scratching. B. Representative images of invasion assays for the CCA cell lines. C. The number of invaded cells was counted in different cell lines. D. The multiple tumor masses (black arrows) formed by the HCCC9810-NC cells were much more than that by HCCC9810-LV-1 cells (top and middle panel). The median survival time of the nude mice zenografted with HCCC9810-NC or HCCC9810-LV-1 cells were 77 and 113 days, respectively (bottom panel). E. The multiple tumor masses (black arrows) formed by the QBC939-vector cells were much less than that by QBC939-YAP cells (top and middle panel). The median survival time of the nude mice zenografted with QBC939-vector cells or QBC939-YAP cells were 94 and 62 days, respectively (bottom panel). Experiments were done three times and data are presented as mean±SD. **P < 0.01; ***P < 0.001.
Figure 4
Figure 4. YAP induces epithelial-mesenchymal transition
A. The expression of YAP, E-cadherin, N-cadherin and Vimentin was evaluated by Western blotting in HCCC9810 and KMBC cells (CON, NC, LV-1). B. E-cadherin and N-cadherin protein expression and subcellular localization were determined by immunofluorescence in QBC939 cells. Scale bar stands for 10μm. C. The expression of YAP, E-cadherin, N-cadherin and Vimentin was also detected by Western blotting in QBC939 and RBE cells stably transfected with YAP or control vector. D. The expression of E-cadherin and N-cadherin was detected by immunohistochemistry in xenograft tumor tissues from HCCC9810-NC, HCCC9810-LV-1, QBC939-vector and QBC939-YAP cells. Scale bar stands for 25μm. E. The sensitivity of HCCC9810 and KMBC cells to 5-FU was significantly enhanced after YAP knockdown. F. Effects of YAP knockdown on drug sensitivity of HCCC9810 cell xenograft tumors in nude mice. All data are the mean±SD of three separate experiments. *P < 0.05; **P < 0.01; ***P < 0.001.
Figure 5
Figure 5. YAP increases gankyrin expression through AKT activation
A. Relative expressions of AKT, p-AKT and gankyrin were evaluated by western blot in YAP konckdown and control CCA cells. B. Relative expression of AKT, p-AKT and gankyrin were evaluated by western blot analysis in YAP overexpressed and control cells. C. The mRNA level of gankyrin in YAP knockdown or overexpression cells compared to the control cells. D. Western blot analysis demonstrated that the AKT inhibitor LY294002 could effectively decreased expressions of p-AKT and gankyrin induced by YAP. E. ELISA analysis of IGF1 production in YAP knockdown or overexpression cells compared with the control cells. F. HCCC9810-LV-1 and KMBC-LV-1 cells were serum-starved, stimulated with IGF1, and immunoblotted for AKT, p-AKT and gankyrin. G. RBE-YAP and QBC939-YAP cells were transfected with IGF1 siRNA, relative expressions of IGF1, p-AKT and gankyrin were detected by Western blotting. All data are the means±SD of three separate experiments. ***P < 0.001.
Figure 6
Figure 6. Gankyin upregulates YAP at transcriptional level and is responsible for YAP-induced oncogenic activity
A. Relative expressions of gankyrin, LATS1, LATS2, YAP and p-YAP were detected by western blot in gankyrin knockdown and control cells. B. Relative expressions of gankyrin, LATS1, LATS2, YAP and p-YAP were detected by western blot analysis in Gankyrin overexpressed and control cells. C.-D. The mRNA level of YAP in gankyrin knockdown or overexpression cells compared to the control cells. E. RBE-YAP and QBC939-YAP cells were transfected with gankyrin siRNA, relative expressions of gankyrin, E-cadherin, N-cadherin were detected by Western blotting. F.-G. Colony formation and invasion assays were done for the QBC939-YAP cells following transfection with gankyrin siRNA. H. Schematic presentation of the mechanism underlying YAP-facilitated cholangiocarcinogenesis and metastasis. The results are presented as mean±SD from three independent experiments. ***P < 0.001.
Figure 7
Figure 7. Combination of nYAP and gankyrin or p-AKT improves prognostic accuracy for CCA patients
A. Representative view of IHC analysis of YAP and gankyrin expression in 90 CCA tissues. Black and red scale bar stands for 100μm and 25μm respectively. B. Correlation between YAP expression and gankyrin or p-AKT level was analyzed by Pearson correlation analysis. C. Kaplan-Meier's analysis of gankyrin expression in CCA patients after curative resection. D. The Kaplan-Meier analysis of concurrent nYAP and gankyrin expression with overall survival. E, Kaplan-Meier's analysis of p-AKT expression in CCA patients after curative resection. F, The Kaplan-Meier analysis of concurrent nYAP and p-AKT expression with overall survival.

References

    1. Malhi H, Gores GJ. Cholangiocarcinoma: modern advances in understanding a deadly old disease. Journal of hepatology. 2006;45:856–867. - PMC - PubMed
    1. Khan SA, Thomas HC, Davidson BR, Taylor-Robinson SD. Cholangiocarcinoma. Lancet. 2005;366:1303–1314. - PubMed
    1. Khan SA, Taylor-Robinson SD, Toledano MB, Beck A, Elliott P, Thomas HC. Changing international trends in mortality rates for liver, biliary and pancreatic tumours. Journal of hepatology. 2002;37:806–813. - PubMed
    1. Lau SH, Lau WY. Current therapy of hilar cholangiocarcinoma. Hepatobiliary & pancreatic diseases international : HBPD INT. 2012;11:12–17. - PubMed
    1. Romiti A, D'Antonio C, Zullo A, Sarcina I, Di Rocco R, Barucca V, Durante V, Marchetti P. Chemotherapy for the biliary tract cancers: moving toward improved survival time. Journal of gastrointestinal cancer. 2012;43:396–404. - PubMed

Publication types

MeSH terms