. 2015 Aug;83(8):3114-25.
doi: 10.1128/IAI.00479-15. Epub 2015 May 26.

Micropatterned macrophage analysis reveals global cytoskeleton constraints induced by Bacillus anthracis edema toxin

Affiliations

Micropatterned macrophage analysis reveals global cytoskeleton constraints induced by Bacillus anthracis edema toxin

Yannick Trescos et al. Infect Immun. 2015 Aug.

Abstract

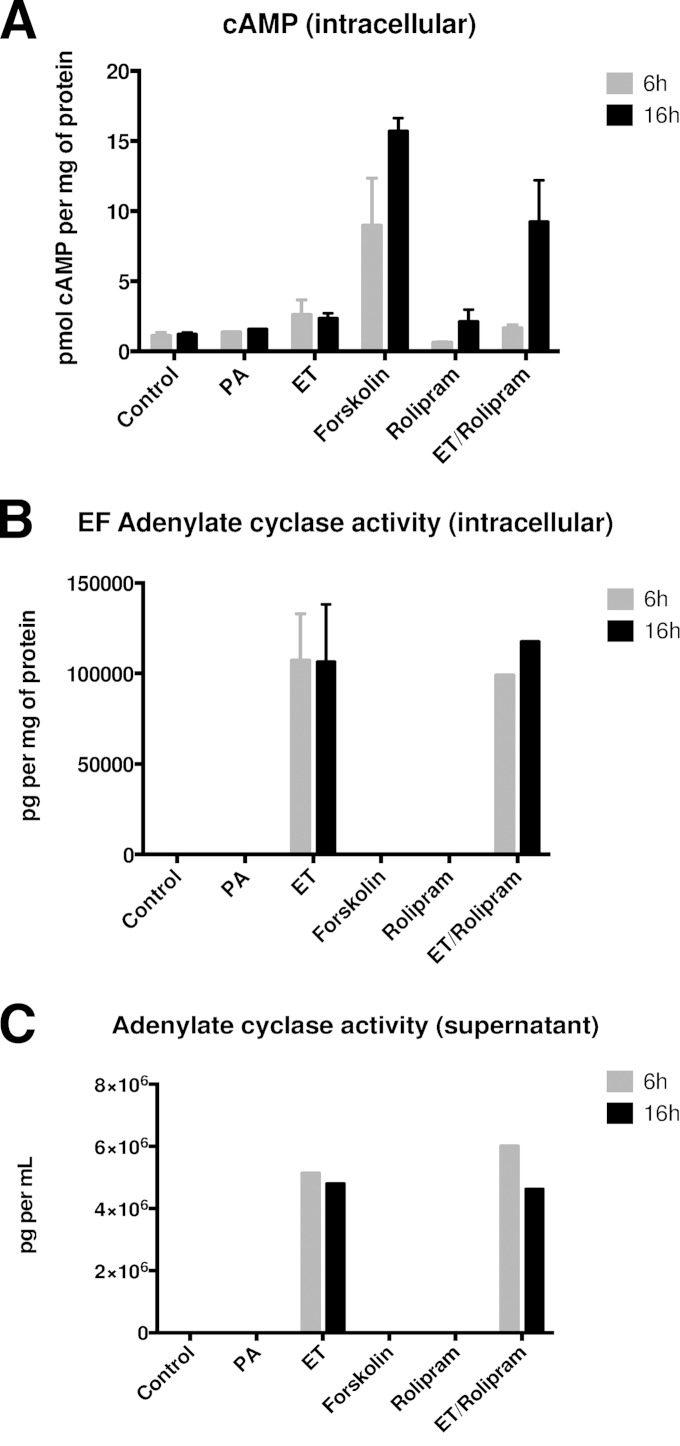
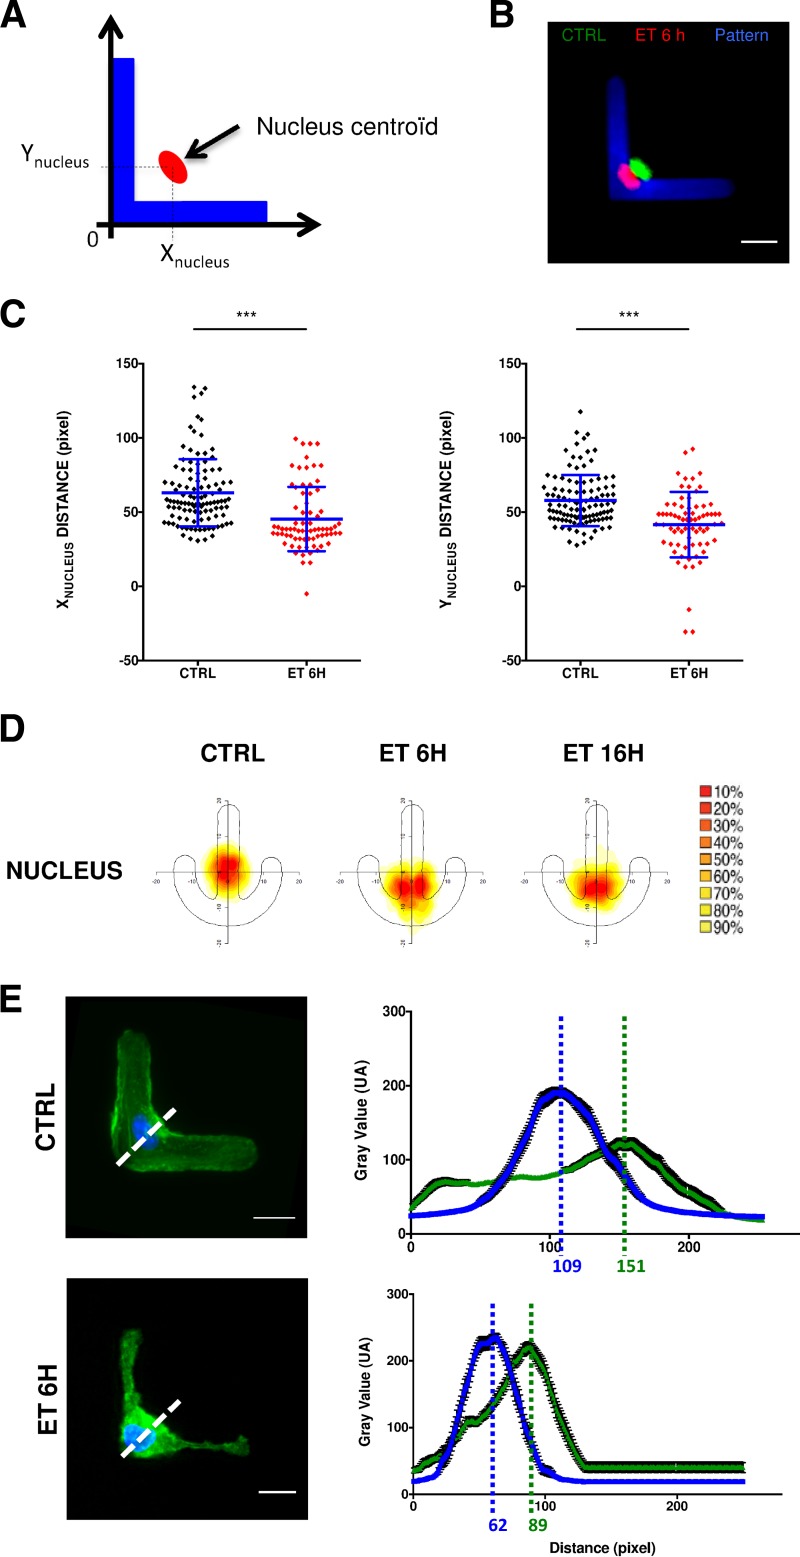
Bacillus anthracis secretes the edema toxin (ET) that disrupts the cellular physiology of endothelial and immune cells, ultimately affecting the adherens junction integrity of blood vessels that in turn leads to edema. The effects of ET on the cytoskeleton, which is critical in cell physiology, have not been described thus far on macrophages. In this study, we have developed different adhesive micropatterned surfaces (L and crossbow) to control the shape of bone marrow-derived macrophages (BMDMs) and primary peritoneal macrophages. We found that macrophage F-actin cytoskeleton adopts a specific polar organization slightly different from classical human HeLa cells on the micropatterns. Moreover, ET induced a major quantitative reorganization of F-actin within 16 h with a collapse at the nonadhesive side of BMDMs along the nucleus. There was an increase in size and deformation into a kidney-like shape, followed by a decrease in size that correlates with a global cellular collapse. The collapse of F-actin was correlated with a release of focal adhesion on the patterns and decreased cell size. Finally, the cell nucleus was affected by actin reorganization. By using this technology, we could describe many previously unknown macrophage cellular dysfunctions induced by ET. This novel tool could be used to analyze more broadly the effects of toxins and other virulence factors that target the cytoskeleton.


Figures

FIG 1
FIG 1
Micropatterned BMDMs as a model for studying host-pathogen interactions. HeLa cells and BMDMs were grown on classical fibronectin-coated coverslips or on micropatterned coverslips. Alexa Fluor 488-phalloidin-stained F-actin is depicted in green, Hoechst 33248-stained nucleus is shown in blue, and Alexa Fluor 650-stained fibronectin is shown in red. (A) Nonconstrained HeLa cells and BMDMs are shown in the left panels, while HeLa cells and BMDMs patterned on the L are shown in the middle panels and those patterned on the crossbow are shown in the right panels. For L- and crossbow-patterned cells, the design of the pattern is depicted in the white square, while one significant cell (red square) is enlarged in the large red square on the right. (B) Empty patterns are shown in the left panels. Reference cells (the median intensity of fluorescence of n cells) of HeLa cells (middle panels) and BMDMs (right panels) are depicted with the median intensity projection (MIP) representation or fire lookup table (LUT) representation. The number of cells used is shown at the bottom of each panel. On L patterns, the hypotenuse of the triangle is referred to as the “nonadhesive” side, and on the crossbow pattern, the adhesive side is the “extrados,” while the nonadhesive sides are called the “bowstrings.” Bars, 10 μm.
FIG 2
FIG 2
B. anthracis ET induces a global actin cytoskeleton rearrangement. BMDMs were treated with 100 ng/ml of ET (e.g., PA at 1 μg/ml and EF at 100 ng/ml) for 6 or 16 h. F-actin is stained in green with Alexa Fluor 488-phalloidin. (A) The effects of ET on BMDM actin are shown on nonconstrained cells versus L-patterned cells 6 h after intoxication. Individual patterned cells are shown in the middle panel (enlarged for one representative in the red square), and the reference cells are shown in the right panels. Bars, 10 μm. (B) The effects of ET on L-patterned cells are shown for cell areas in the left panel, for circularity in the middle panel, and for aspect ratio in the right panel. Each dot represents one cell. (C) The effects of ET on BMDM actin are shown on nonconstrained cells versus crossbow-patterned cells 6 and 16 h after intoxication. Individual patterned cells are shown in the middle panel (enlarged for one representative in the red square), and the reference cells are shown in the right panels. Bars, 10 μm. (D) The effects of ET on crossbow-patterned cells are shown for cell area in the left panel, for circularity in the middle panel, and for aspect ratio in the right panel. Each dot represents one cell. (E) The density maps of F-actin are shown for control cells and after 6 and 16 h of intoxication. The colors represent the smallest regions that contain the percentages of analyzed structures from 10% (red) to 90% (yellow). ***, P < 0.001; ns, nonsignificant.
FIG 3
FIG 3
Analysis of actin distribution along different axes on patterned cells. (A) The reference cells (MIP) for F-actin on crossbow patterns have been overlaid for control cells (green) and for ET at 6 h (red) and 16 h (blue). The MIPs for pixels on each axis (x axis and y axis) are represented in the histograms with an overlay of control cell (green line), ET at 6 h (red line), and ET at 16 h (blue line). Bars, 10 μm. (B) The reference cells (MIP) for F-actin on L patterns have been overlaid for control cells (green) and ET at 6 h (red). The MIPs for pixels on each axis (x axis, y axis, and diagonal axis) are represented in the histograms with an overlay of control cell (green line) and ET at 6 h (red line). Bars, 10 μm.
FIG 4
FIG 4
B. anthracis ET induces an actin cytoskeleton rearrangement on micropatterned peritoneal macrophages. Peritoneal macrophages were grown on crossbow-micropatterned coverslips. Alexa Fluor 488-phalloidin-stained F-actin is depicted in green, and Alexa Fluor 650-stained fibronectin is shown in red. (A) Peritoneal macrophages patterned on a crossbow shape are shown in the left panels. The design of the pattern is depicted in the white square, while one significant cell (red square) is enlarged in the large red square on the right. Reference cells of peritoneal macrophages (right panels) are depicted with the median intensity projection (MIP) representation or fire lookup table (LUT) representation. The number of cells used is shown at the bottom of each panel. Bars, 10 μm. (B) Peritoneal macrophages were treated with 100 ng/ml of ET (e.g., 1 μg/ml PA and 100 ng/ml EF) for 6 h. F-actin is stained in green with Alexa Fluor 488-phalloidin. Individual patterned cells are shown in the left panel (enlarged for one representative in the red square), and the reference cells are shown in the right panels. The number of cells used is shown at the bottom of each panel. Bars, 10 μm.
FIG 5
FIG 5
Effects of ET on intracellular cAMP. BMDMs were treated with PA (1 μg/ml), ET (1 μg/ml PA plus 100 ng/ml EF), forskolin (100 μM), Rolipram (10 μM), and ET plus Rolipram. After 6 or 16 h of incubation, supernatant and cell lysates were collected to measure cAMP concentration in cell lysate and EF adenylate cyclase activity in cell lysate and supernatant. The data are the most representative of 3 experiments. (A) Quantification of intracellular cAMP under indicated conditions and periods of time following intoxication. Data are presented as picomoles of cAMP per milligram of protein lysate. (B) Quantification of the EF adenylate cyclase activity in cell lysates under indicated conditions and periods of time following intoxication. Data are presented as picograms of EF per milligram of protein lysate. (C) Quantification of the EF adenylate cyclase activity in supernatant under indicated conditions and periods of time following intoxication. Data are presented as picograms of EF per milliliter of supernatant.
FIG 6
FIG 6
Analysis of nuclear shape deformation. BMDMs were treated with 100 ng/ml of ET (e.g., 1 μg/ml PA and 100 ng/ml EF) for 6 or 16 h. The nuclei are stained in blue with Hoechst 33248, and the fibronectin patterns are shown in red with Alexa Fluor 650. (A) The effects of ET on BMDM median intensity projection (MIP) of nucleus are shown on crossbow-patterned cells 6 and 16 h after intoxication. Empty patterns are on the left, MIPs of nuclei are in the middle panels, and the merged images are in the right panels. Bars, 10 μm. (B) The effects of ET on nuclei of crossbow-patterned cells are plotted for nucleus area (top panel), circularity (middle panel), and aspect ratio (bottom panel) for control cells and at 6 and 16 h. Each dot represents one cell. (C) The effects of ET on BMDM MIP of nucleus are shown on L-patterned cells 6 h after intoxication. Empty patterns are on the left, MIPs of nuclei are in the middle panels, and merged images are in the right panels. Bars, 10 μm. (D) The effects of ET on nuclei of L-patterned cells are plotted for nucleus area (top panel), circularity (middle panel) and aspect ratio (bottom panel) for control cells and at 6 h. Each dot represents one cell. ***, P < 0.001; ns, nonsignificant.
FIG 7
FIG 7
Nucleus displacement is correlated with actin reorganization. (A) The diagram shows how the coordinates of the nucleus centroid (in red) are calculated along the axes (x and y) drawn along the pattern (in blue). (B) The picture highlights displacement of the nucleus induced by ET by the overlay of the nucleus of a control (green) and cells treated with ET for 6 h (red). Bar, 10 μm. (C) Coordinates of the nucleus centroid on the x (left panel) and y (right panel) axes are plotted for control and cells treated with ET for 6 h. Each dot represents one cell. ***, P < 0.001. (D) The density maps of the nucleus are shown for control cells and after 6 and 16 h of treatment with ET. Colors represent the smallest regions that contain the percentages of analyzed structures from 10% (red) to 90% (yellow). (E) The median intensity value (±standard error of the mean) of each pixel (blue, nucleus; green, actin) is calculated on a diagonal starting at the bottom left corner of the L micropattern and going up to the nonadhesive edge of the cell. Bars, 10 μm.

Similar articles

Cited by

References

    1. Mock M, Fouet A. 2001 Anthrax. Annu Rev Microbiol 55:647–671. doi:10.1146/annurev.micro.55.1.647. - DOI - PubMed
    1. Moayeri M, Leppla SH. 2009. Cellular and systemic effects of anthrax lethal toxin and edema toxin. Mol Aspects Med 30:439–455. doi:10.1016/j.mam.2009.07.003. - DOI - PMC - PubMed
    1. Guichard A, Nizet V, Bier E. 2012. New insights into the biological effects of anthrax toxins: linking cellular to organismal responses. Microbes Infect 14:97–118. doi:10.1016/j.micinf.2011.08.016. - DOI - PMC - PubMed
    1. van der Goot G, Young JA. 2009. Receptors of anthrax toxin and cell entry. Mol Aspects Med 30:406–412. doi:10.1016/j.mam.2009.08.007. - DOI - PMC - PubMed
    1. Wei W, Lu Q, Chaudry GJ, Leppla SH, Cohen SN. 2006. The LDL receptor-related protein LRP6 mediates internalization and lethality of anthrax toxin. Cell 124:1141–1154. doi:10.1016/j.cell.2005.12.045. - DOI - PubMed

Publication types