. 2015 Jun 9;112(23):7225-30.
doi: 10.1073/pnas.1508224112. Epub 2015 May 26.

Sialyl Lewis x (CD15s) identifies highly differentiated and most suppressive FOXP3high regulatory T cells in humans

Affiliations

Sialyl Lewis x (CD15s) identifies highly differentiated and most suppressive FOXP3high regulatory T cells in humans

Makoto Miyara et al. Proc Natl Acad Sci U S A. .

Abstract

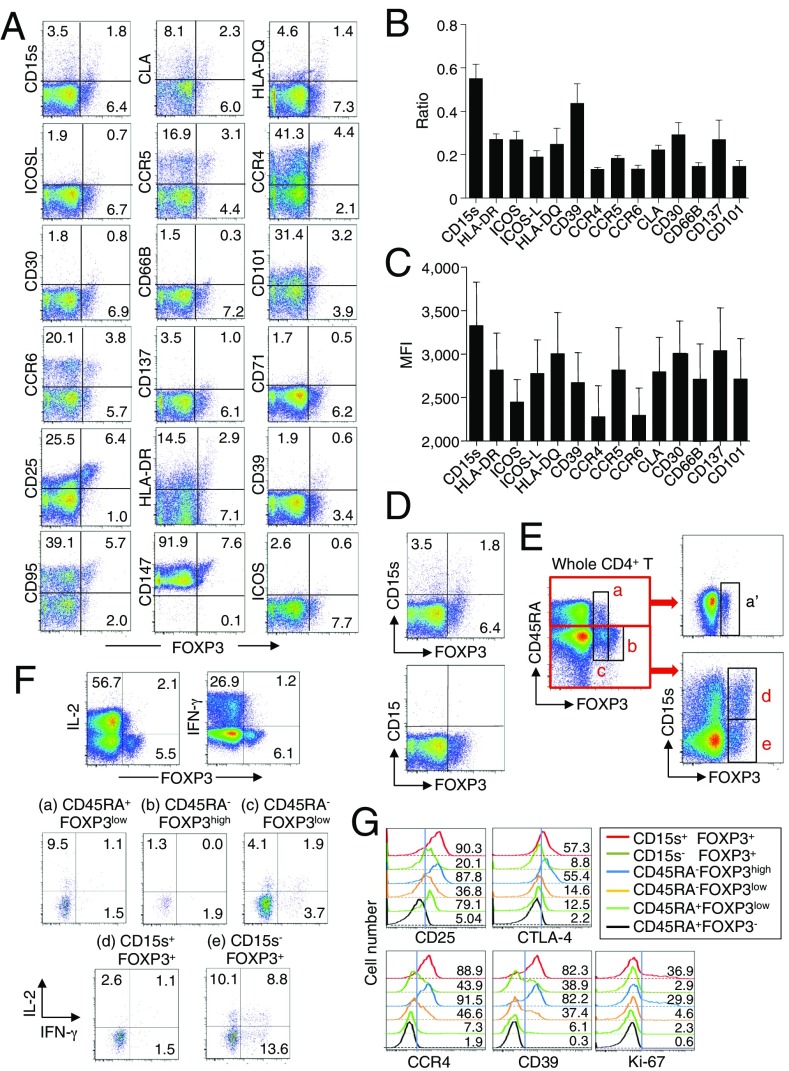
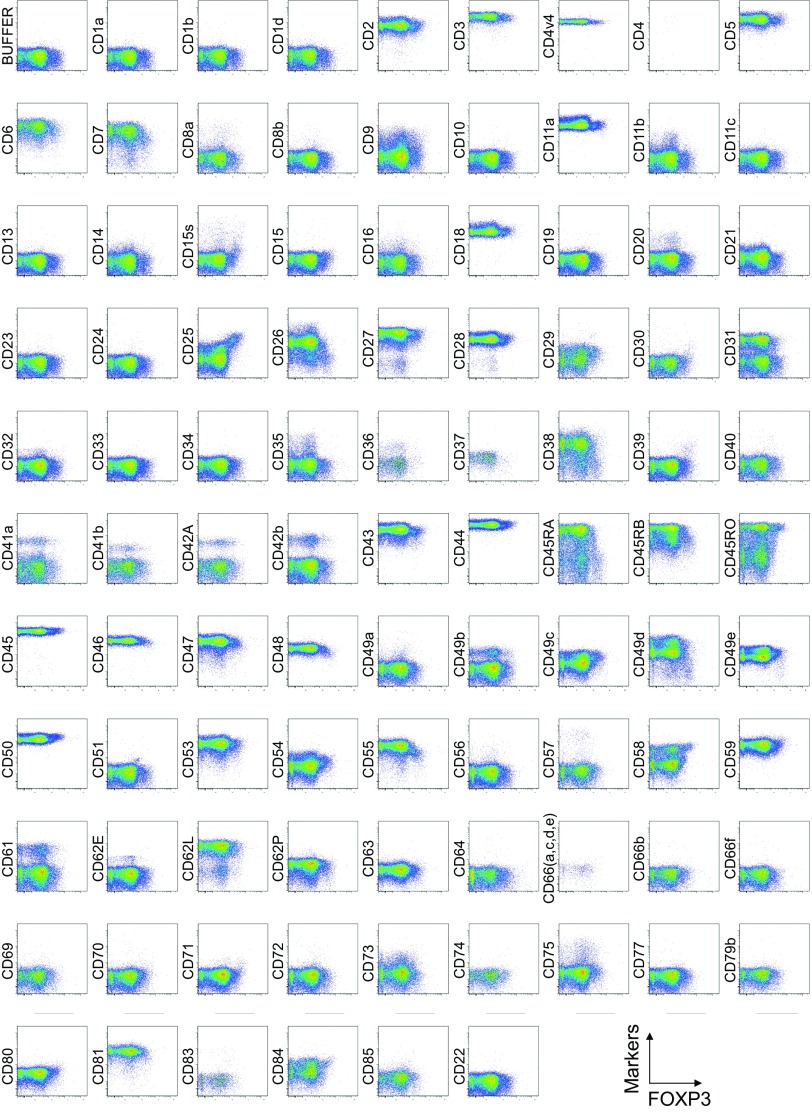
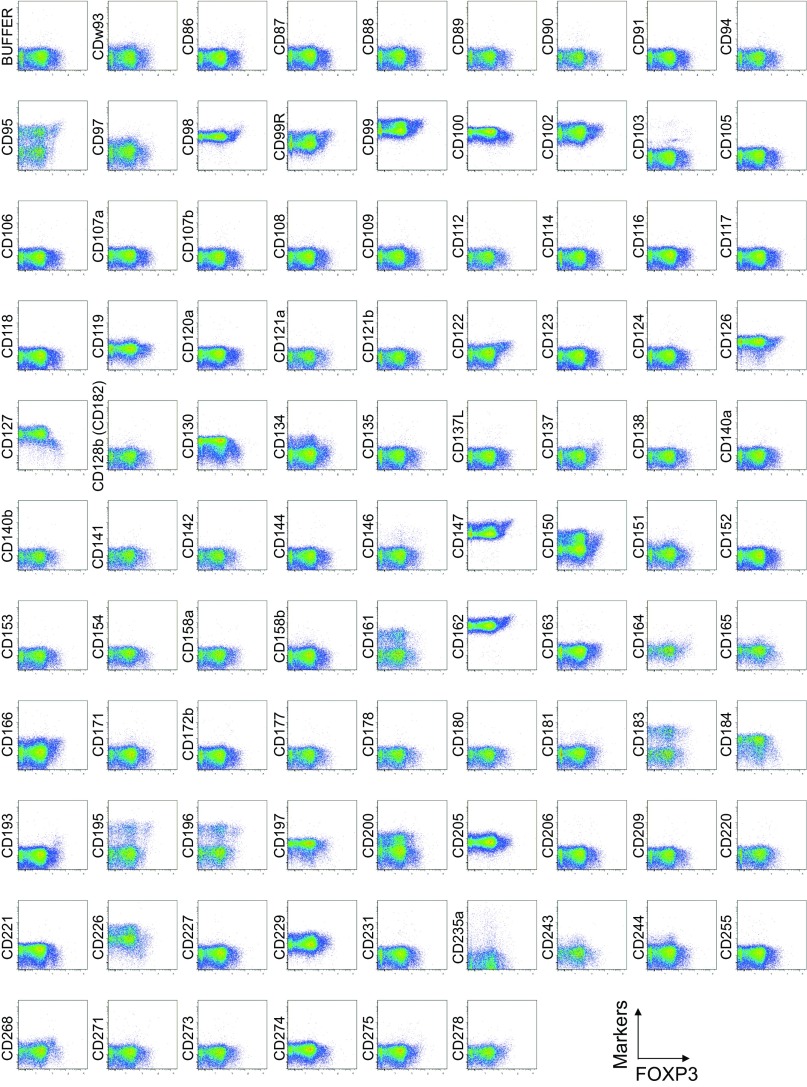
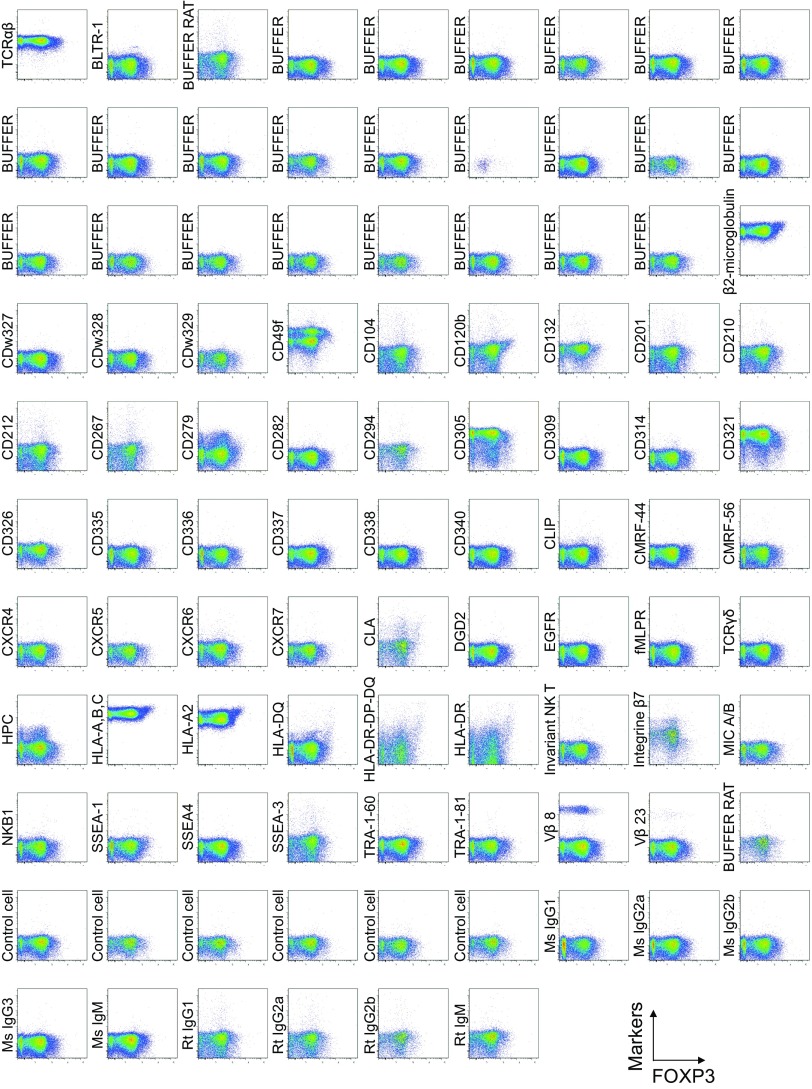
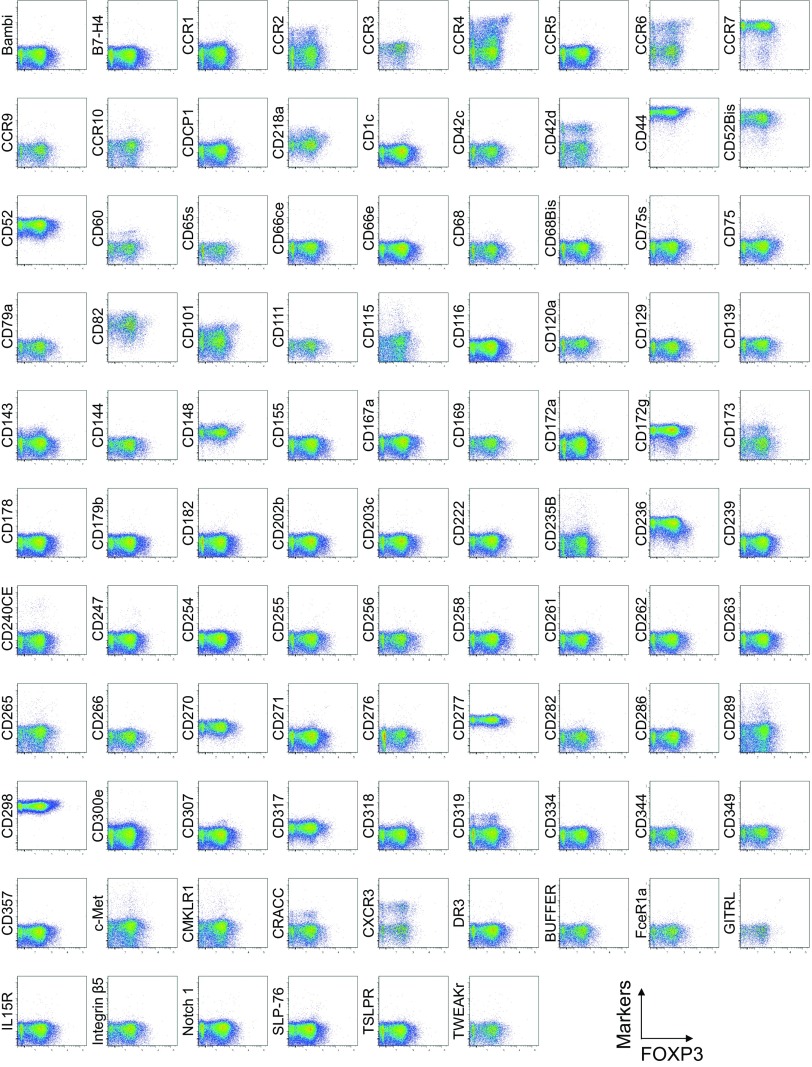
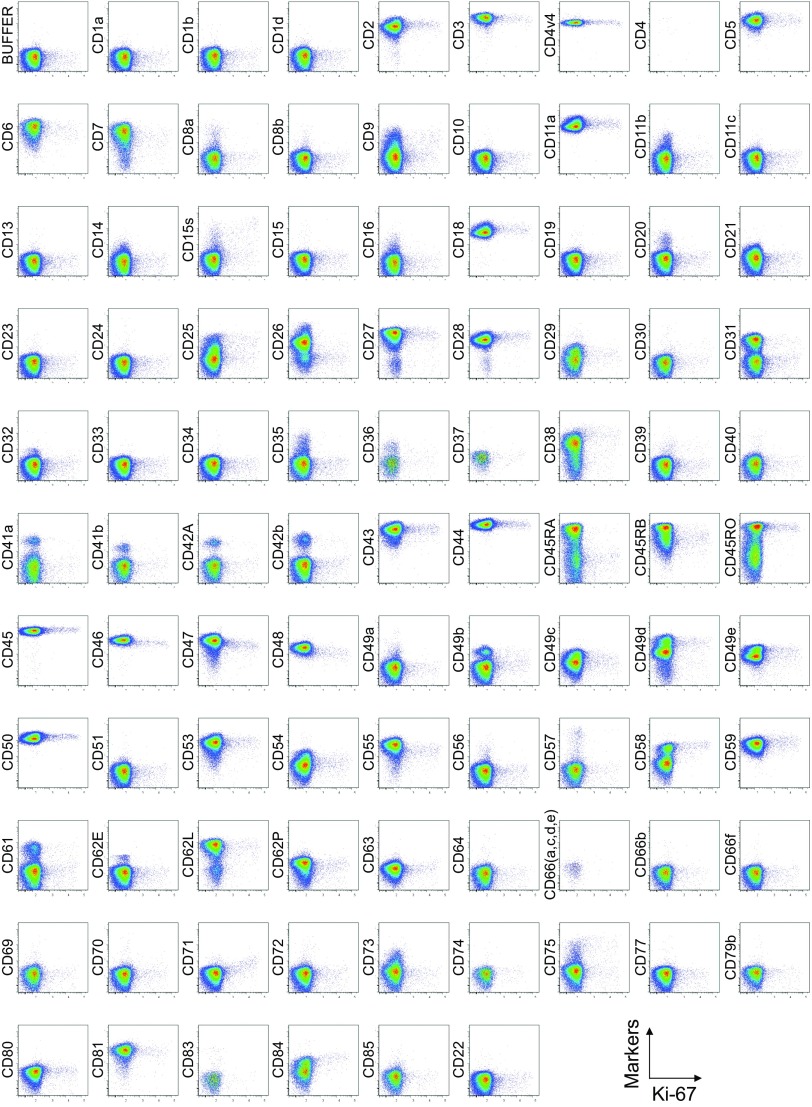
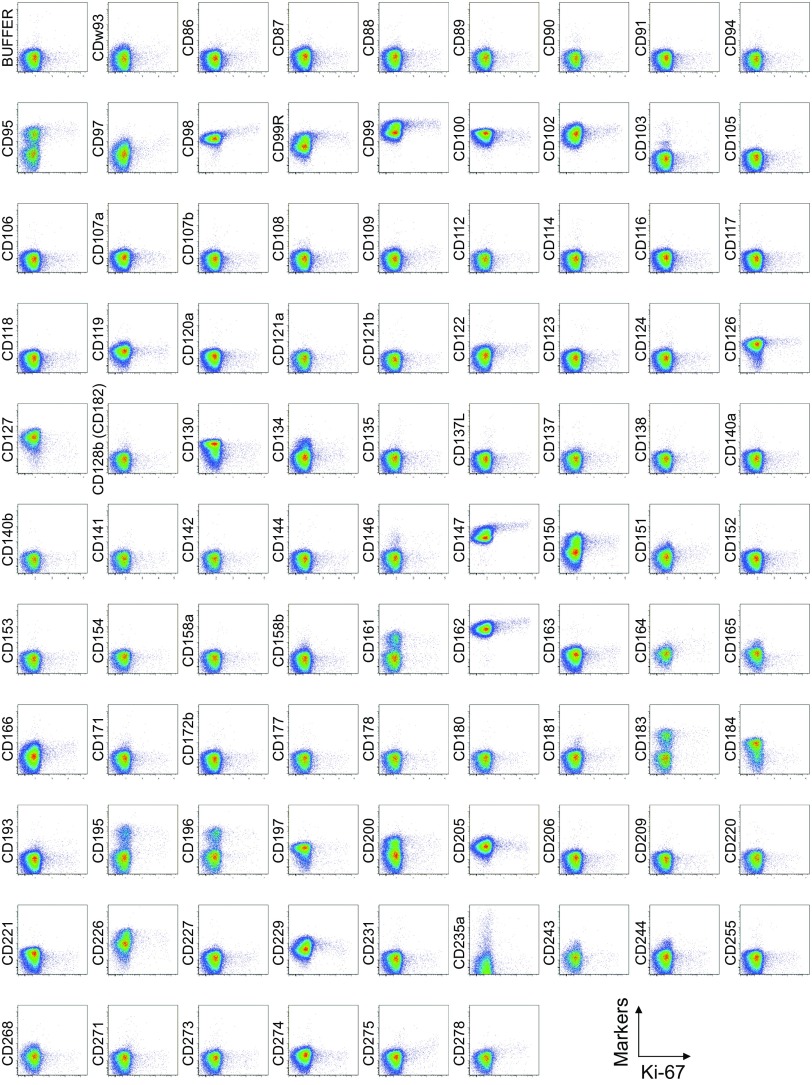
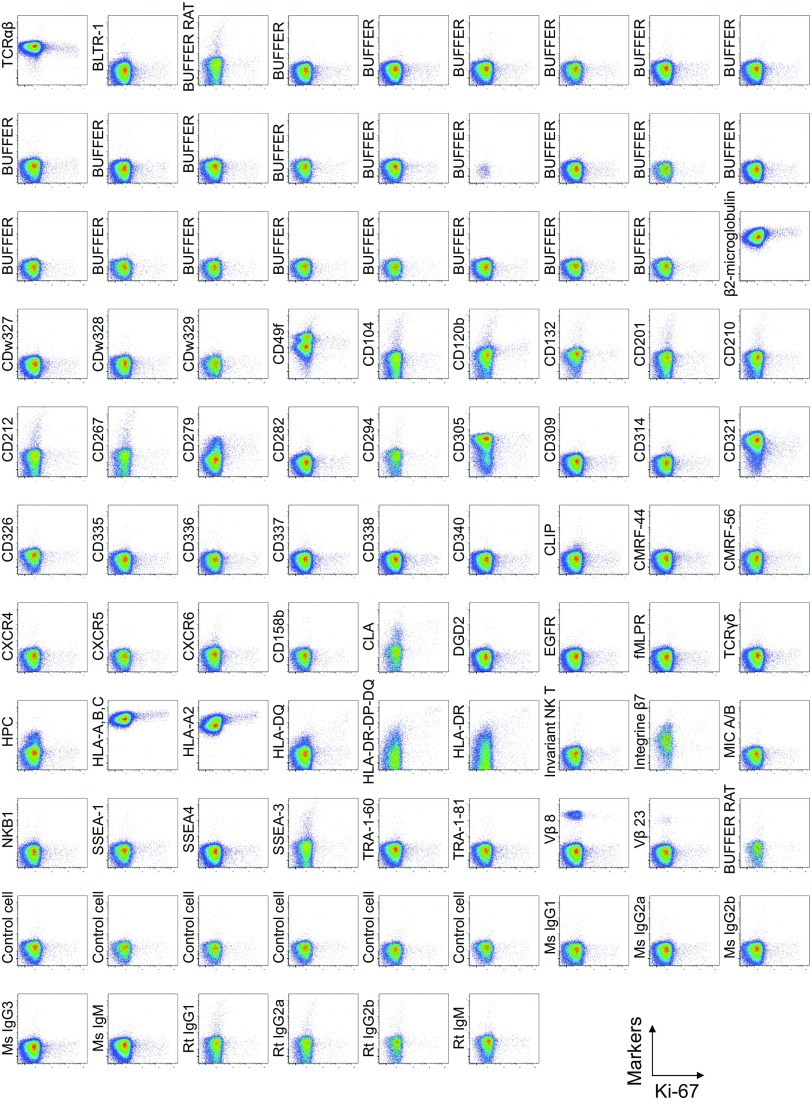
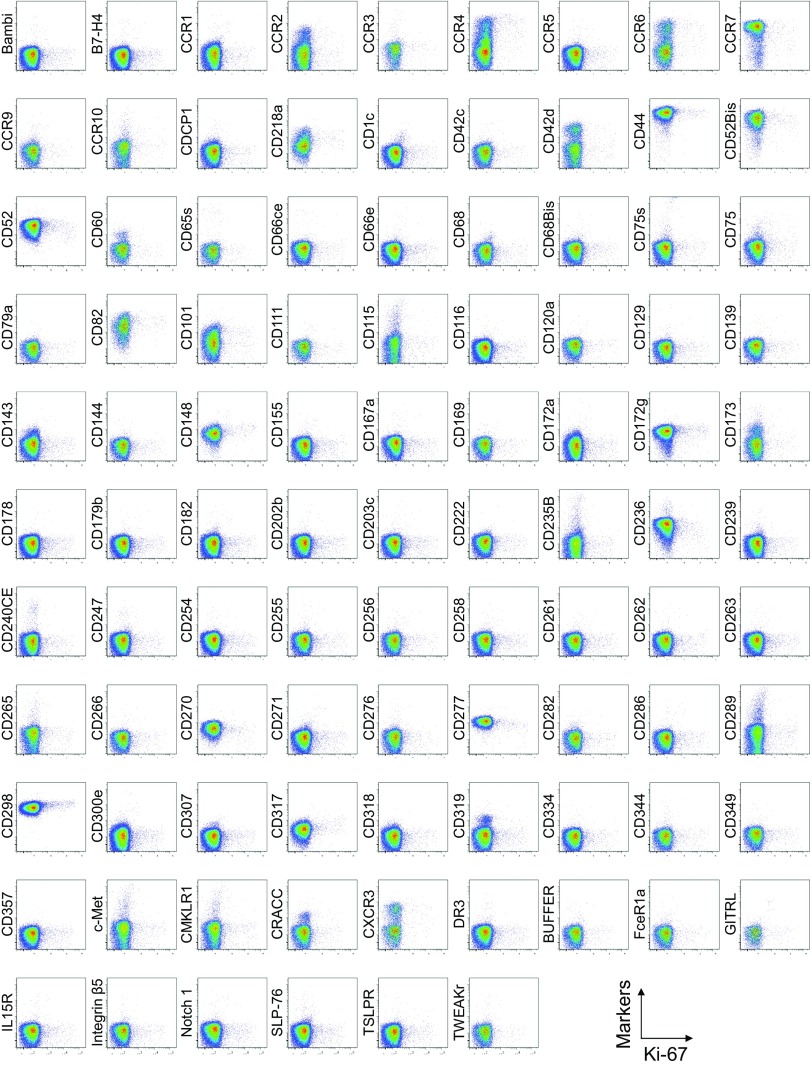
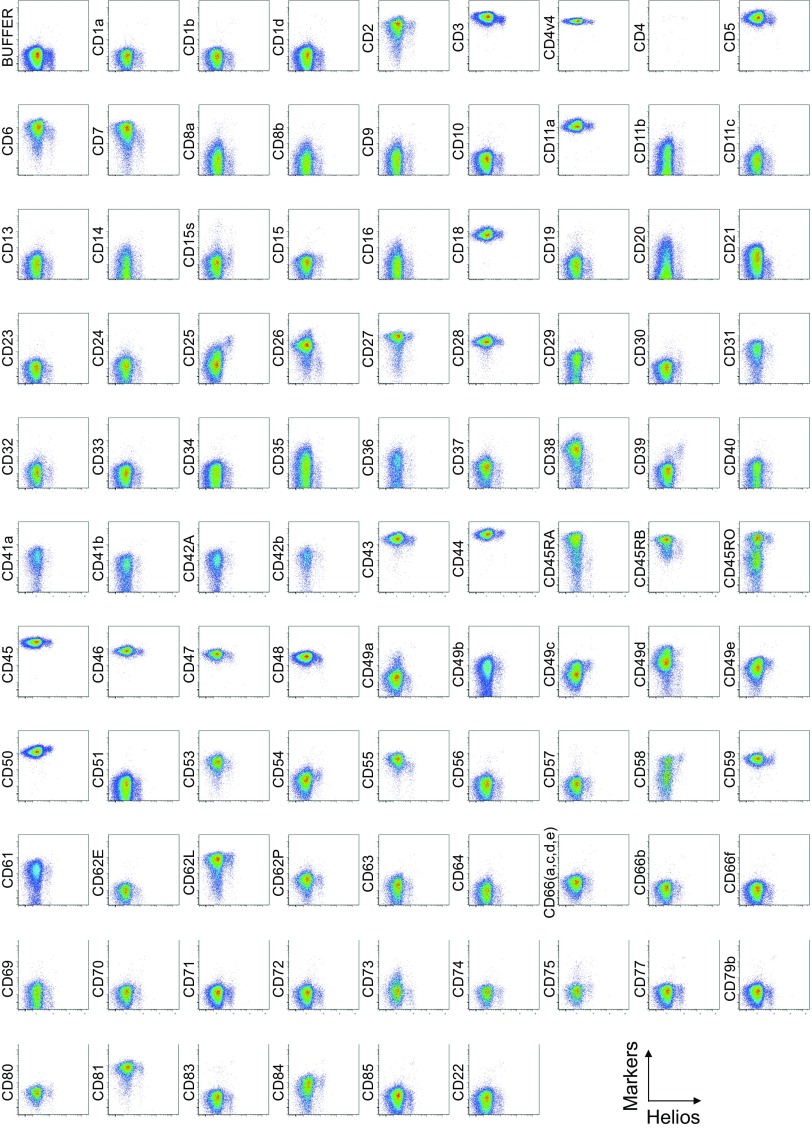
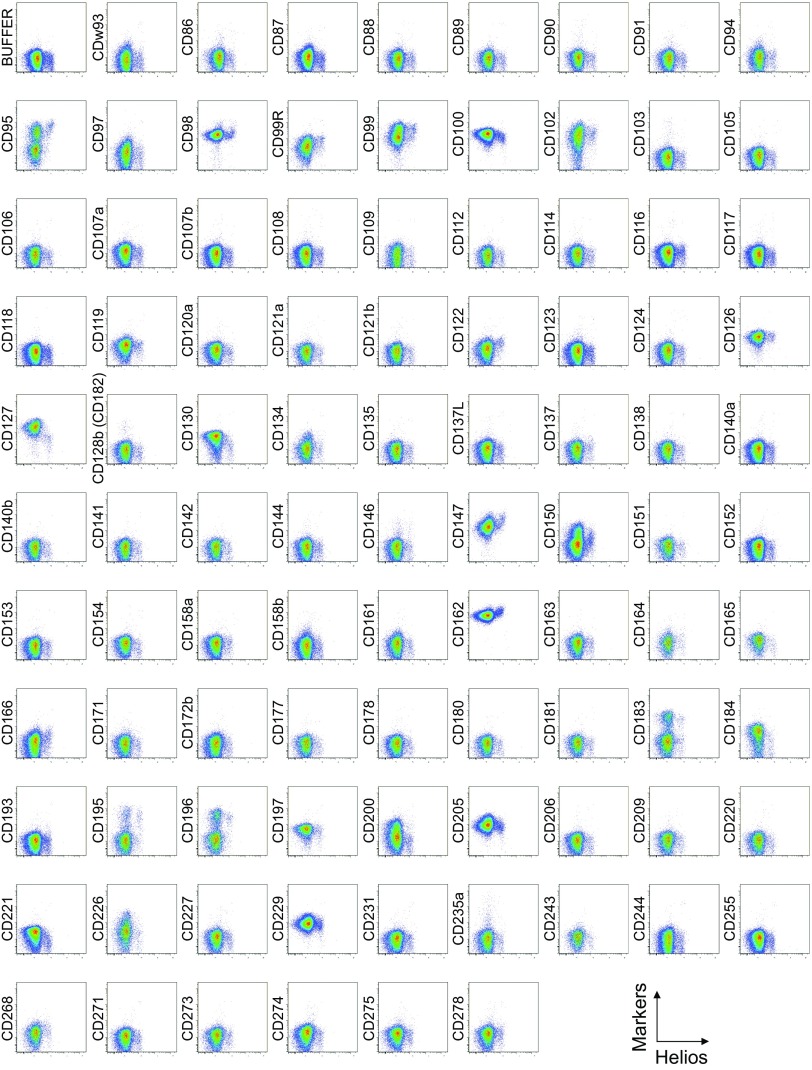
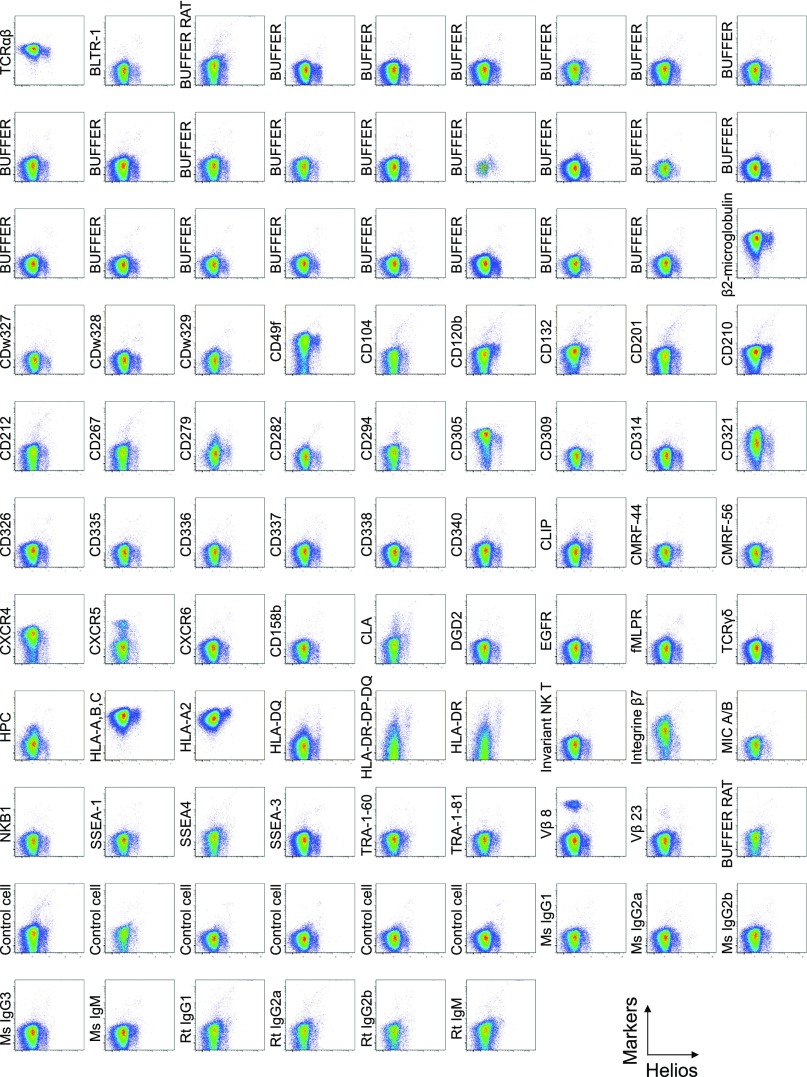
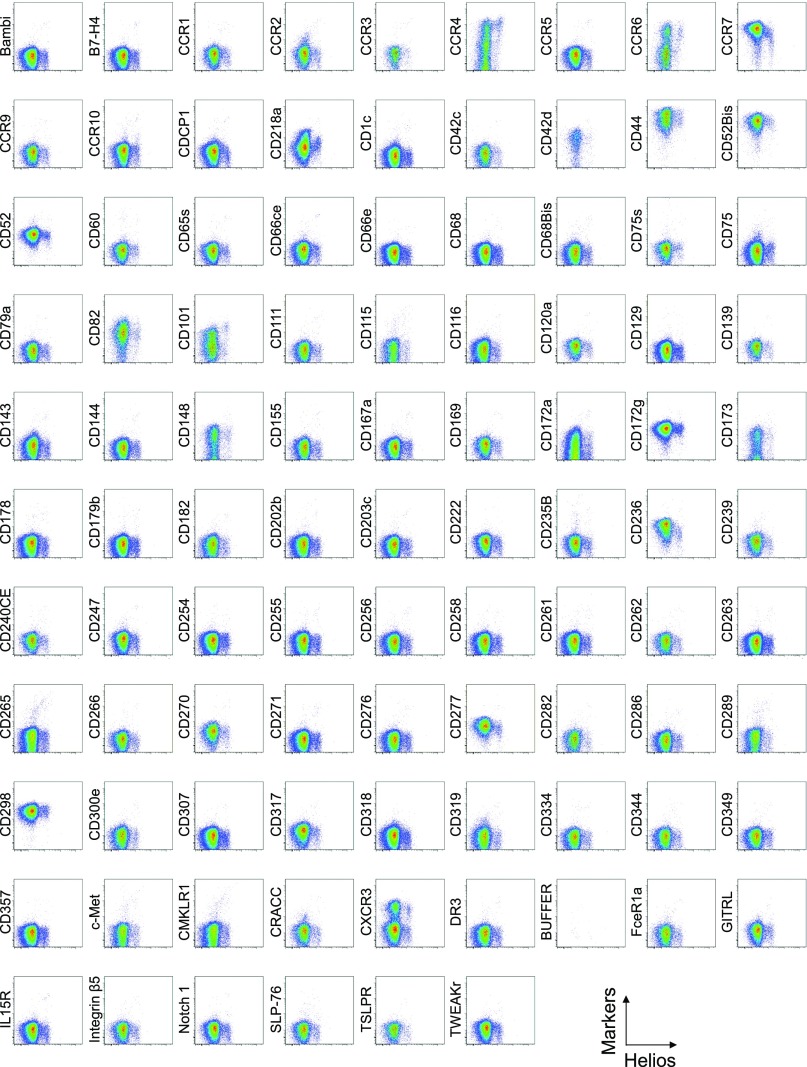
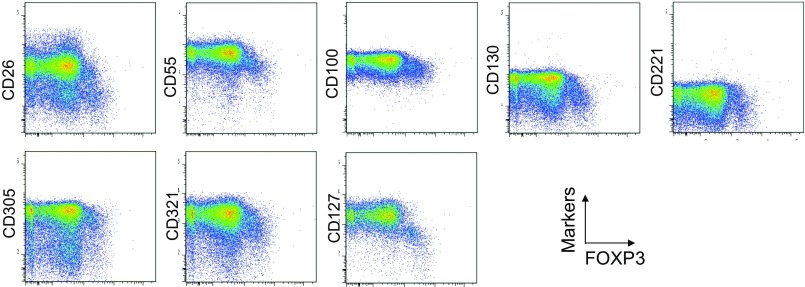
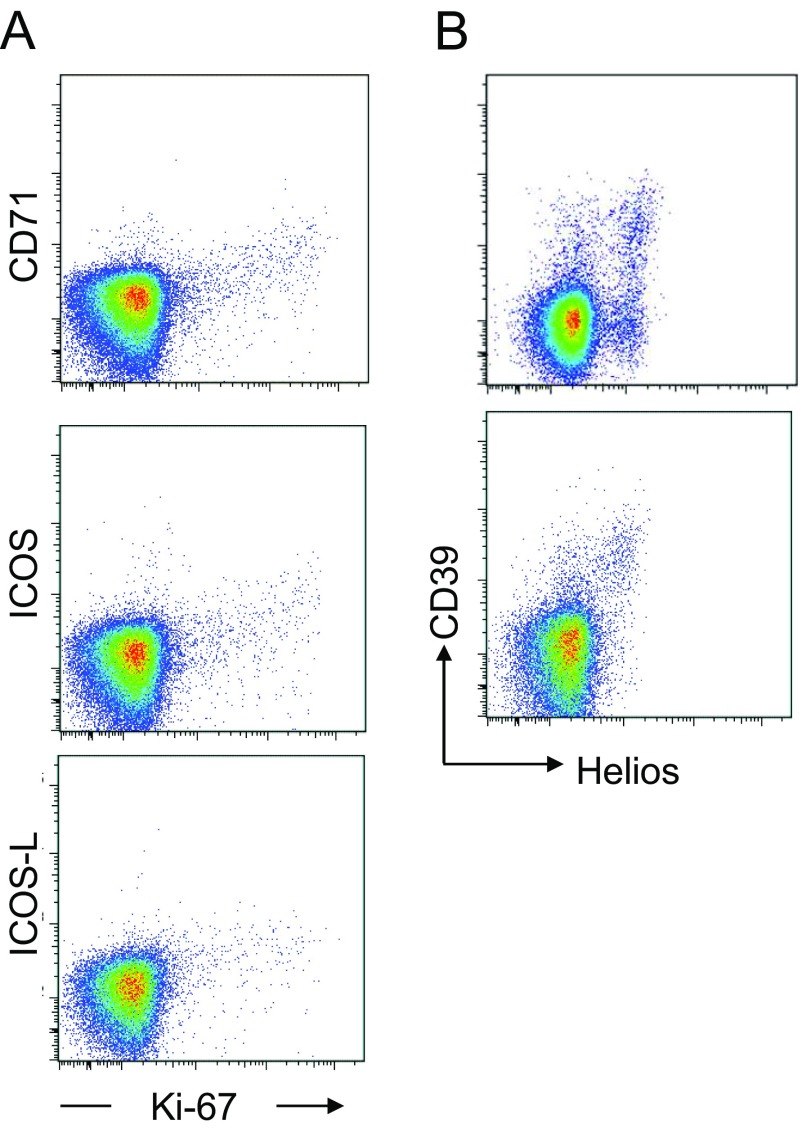
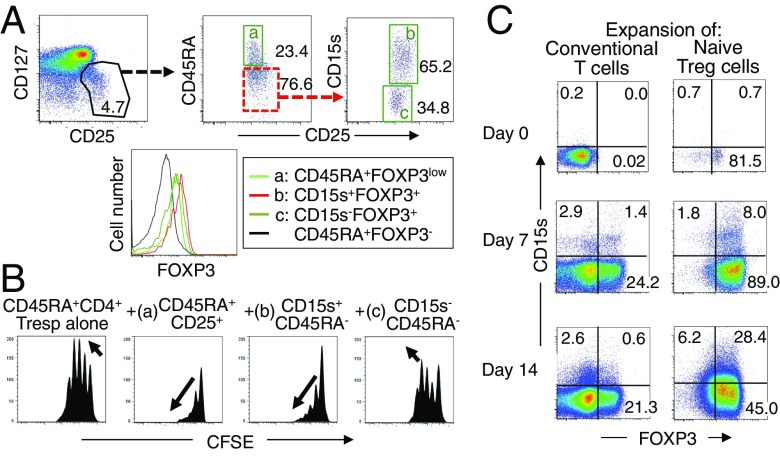
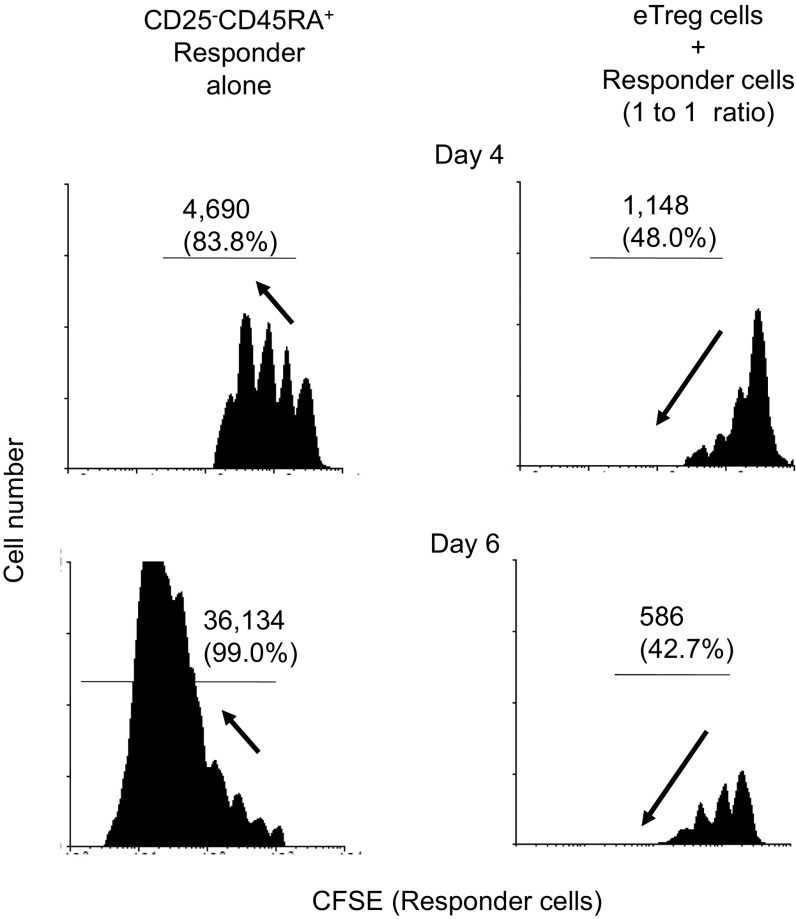
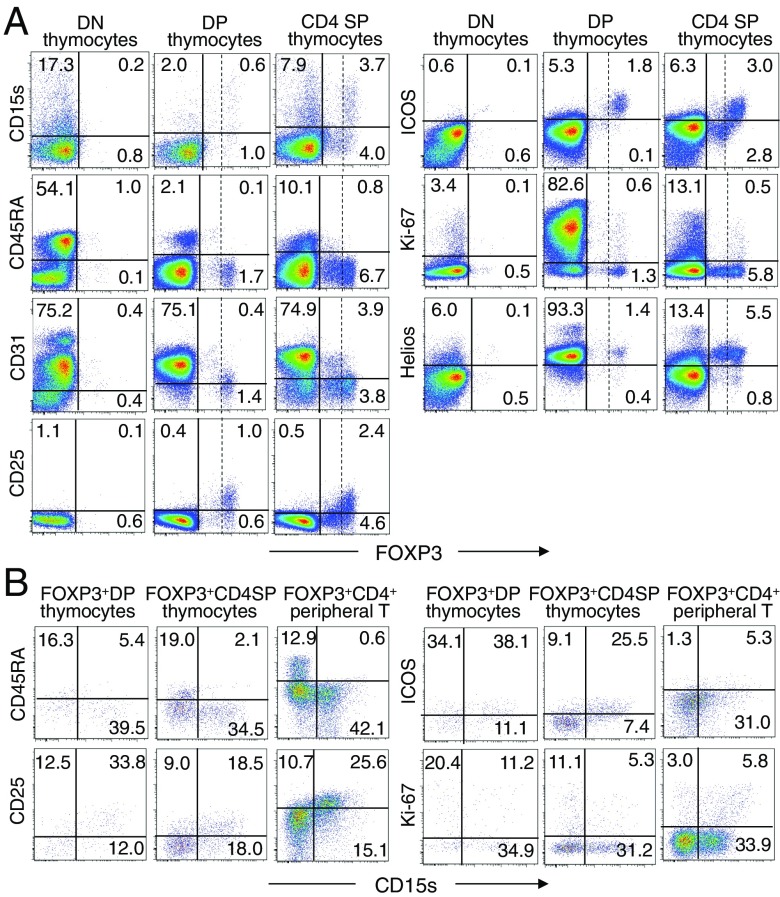
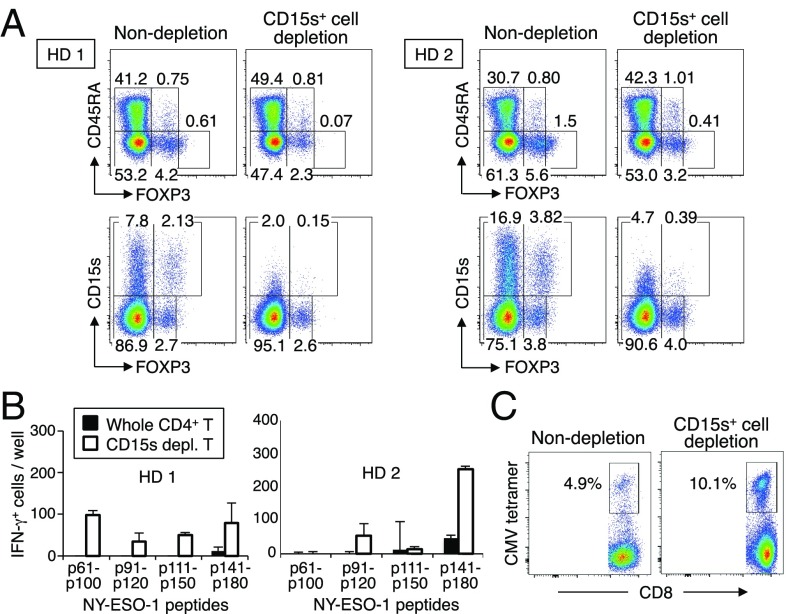
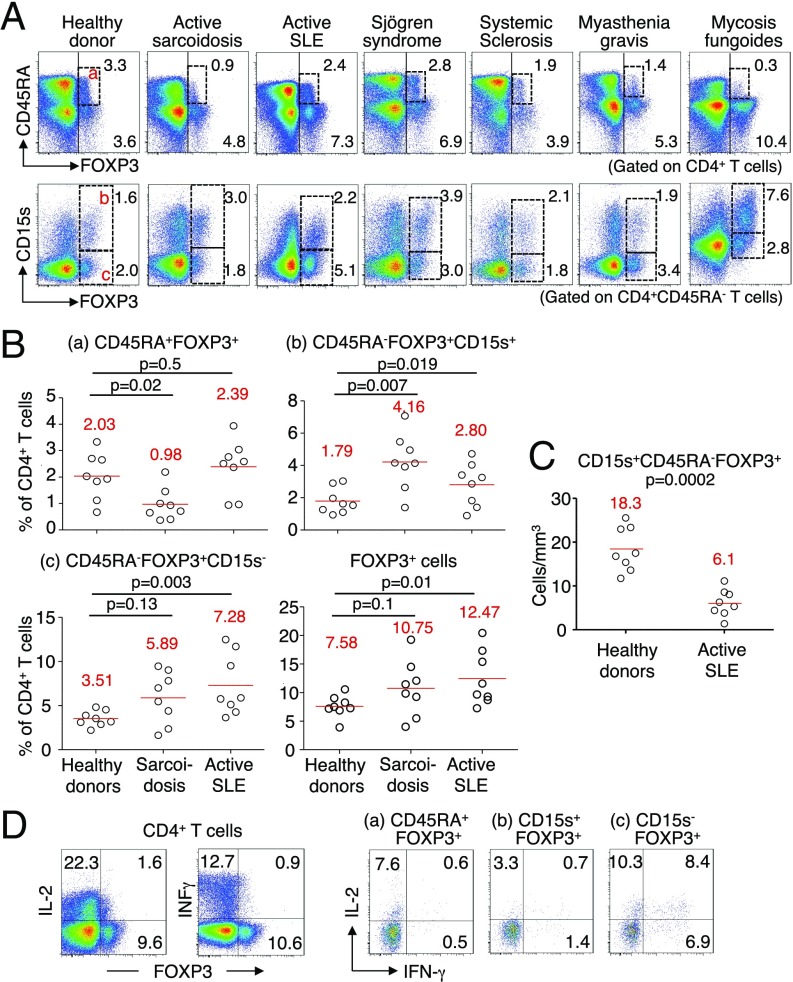
CD4(+) regulatory T (Treg) cells expressing CD25 and the transcription factor forkhead box P3 (FOXP3) are indispensable for immunological self-tolerance and homeostasis. FOXP3(+)CD25(+)CD4(+) T cells in humans, however, are heterogeneous in function and differentiation status, including suppressive or nonsuppressive cells as well as resting or activated Treg cells. We have searched for cell surface markers specific for suppression-competent Treg cells by using a panel of currently available monoclonal antibodies reactive with human T cells. We found that CD15s (sialyl Lewis x) was highly specific for activated, terminally differentiated, and most suppressive FOXP3(high) effector Treg (eTreg) cells and able to differentiate them in various clinical settings from nonsuppressive FOXP3(+) T cells secreting inflammatory cytokines. For example, CD15s(+)FOXP3(+) eTreg cells were increased in sarcoidosis, whereas it was nonsuppressive CD15s(-)FOXP3(+) T cells that were expanded in lupus flares. FOXP3(+) cells induced from conventional CD4(+) T cells by T-cell receptor stimulation hardly expressed CD15s. CD15s(+)CD4(+) T-cell depletion was sufficient to evoke and enhance in vitro immune responses against tumor or viral antigens. Collectively, we have identified CD15s as a biomarker instrumental in both phenotypic and functional analysis of FOXP3(+)CD4(+) T-cell subpopulations in health and disease. It allows specific targeting of eTreg cells, rather than whole FOXP3(+)CD4(+) T cells, in controlling immune responses.

Keywords: CD15s; FOXP3; autoimmunity; regulatory T cells; tumor immunity.


Conflict of interest statement

The authors declare no conflict of interest.

Figures

Fig. 1.
Fig. 1.
Cell surface markers for FOXP3+CD4+ T-cell subpopulations. (A) Expression of intracellular FOXP3 and each indicated surface marker by CD4+ T cells in a healthy donor. (B) Ratios obtained as the proportion of marker+ FOXP3+ cells among CD4+ T cells divided by the proportion of marker+FOXP3 cells among CD4+ T cells. (C) MFI of FOXP3 expression by marker+FOXP3+ cells. (D) CD4+ T-cell expression of FOXP3 and CD15s or CD15. (E) FOXP3+ subpopulations (a–c) depicted by staining of CD4+ T cells for FOXP3 and CD45RA expression were further divided into three populations (a′, d, and e) by the level of CD15s expression. AE are representative of six independent experiments. (F) IL-2 and IFN-γ production in CD4+ T cells (Top) and gated CD4+ T-cell subsets as defined in E, after stimulation with PMA and ionomycin for 5 h. Percentages of cytokine-secreting cells are shown. (G) Analysis of CD25, intracellular CTLA-4, CCR4, CD39, and Ki-67 expression by indicated populations. F and G are representative of three independent experiments.
Fig. S1.
Fig. S1.
Cell surface marker expression by FOXP3-expressing CD4+ T cells. Expression of intracellular FOXP3 and each indicated surface marker assessed by flow cytometry of PBMCs gated on CD4+ T cells. Data are representative of 6 healthy donors. PBMCs were first incubated with unconjugated antibodies, then with dye-conjugated antibodies (CD3, CD8, CD4, CD45RA, CD25, HLA-DR, ICOS, CD31, FOXP3, Ki-67, and Helios). In CD4 panels, because unconjugated and dye-conjugated anti-CD4 mAb was of the same clone (RPA-T4), the dye-conjugated anti-CD4 mAb failed to stain after incubating with the unconjugated anti-CD4 mAb.
Fig. S1.
Fig. S1.
Cell surface marker expression by FOXP3-expressing CD4+ T cells. Expression of intracellular FOXP3 and each indicated surface marker assessed by flow cytometry of PBMCs gated on CD4+ T cells. Data are representative of 6 healthy donors. PBMCs were first incubated with unconjugated antibodies, then with dye-conjugated antibodies (CD3, CD8, CD4, CD45RA, CD25, HLA-DR, ICOS, CD31, FOXP3, Ki-67, and Helios). In CD4 panels, because unconjugated and dye-conjugated anti-CD4 mAb was of the same clone (RPA-T4), the dye-conjugated anti-CD4 mAb failed to stain after incubating with the unconjugated anti-CD4 mAb.
Fig. S2.
Fig. S2.
Cell surface marker expression by Ki-67–expressing CD4+ T cells. Expression of intracellular Ki-67 and each indicated surface marker assessed by flow cytometry of PBMCs gated on CD4+ T cells. Data are representative of 6 healthy donors. PBMCs were first incubated with unconjugated antibodies, then with dye-conjugated antibodies (CD3, CD8, CD4, CD45RA, CD25, HLA-DR, ICOS, CD31, FOXP3, Ki-67, and Helios). In CD4 panels, because unconjugated and dye-conjugated anti-CD4 mAb was of the same clone (RPA-T4), the dye-conjugated anti-CD4 mAb failed to stain after incubating with the unconjugated anti-CD4 mAb.
Fig. S2.
Fig. S2.
Cell surface marker expression by Ki-67–expressing CD4+ T cells. Expression of intracellular Ki-67 and each indicated surface marker assessed by flow cytometry of PBMCs gated on CD4+ T cells. Data are representative of 6 healthy donors. PBMCs were first incubated with unconjugated antibodies, then with dye-conjugated antibodies (CD3, CD8, CD4, CD45RA, CD25, HLA-DR, ICOS, CD31, FOXP3, Ki-67, and Helios). In CD4 panels, because unconjugated and dye-conjugated anti-CD4 mAb was of the same clone (RPA-T4), the dye-conjugated anti-CD4 mAb failed to stain after incubating with the unconjugated anti-CD4 mAb.
Fig. S3.
Fig. S3.
Cell surface marker expression by Helios-expressing CD4+ T cells. Expression of intracellular Helios and each indicated surface marker assessed by flow cytometry of PBMCs gated on CD4+ T cells. Data are representative of 6 healthy donors. PBMCs were first incubated with unconjugated antibodies, then with dye-conjugated antibodies (CD3, CD8, CD4, CD45RA, CD25, HLA-DR, ICOS, CD31, FOXP3, Ki-67, and Helios). In CD4 panels, because unconjugated and dye-conjugated anti-CD4 mAb was of the same clone (RPA-T4), the dye-conjugated anti-CD4 mAb failed to stain after incubating with the unconjugated anti-CD4 mAb.
Fig. S3.
Fig. S3.
Cell surface marker expression by Helios-expressing CD4+ T cells. Expression of intracellular Helios and each indicated surface marker assessed by flow cytometry of PBMCs gated on CD4+ T cells. Data are representative of 6 healthy donors. PBMCs were first incubated with unconjugated antibodies, then with dye-conjugated antibodies (CD3, CD8, CD4, CD45RA, CD25, HLA-DR, ICOS, CD31, FOXP3, Ki-67, and Helios). In CD4 panels, because unconjugated and dye-conjugated anti-CD4 mAb was of the same clone (RPA-T4), the dye-conjugated anti-CD4 mAb failed to stain after incubating with the unconjugated anti-CD4 mAb.
Fig. S4.
Fig. S4.
Cell surface markers down-regulated in FOXP3high eTreg cells. Eight surface markers were down-regulated in FOXP3high eTreg cells detected by analyzing 323 mAbs as shown in Fig. S1. Expression of intracellular FOXP3 and each indicated surface marker was analyzed by flow cytometry of PBMCs gated on CD4+ T cells. Data are representative of six healthy donors.
Fig. S5.
Fig. S5.
Surface markers correlated with Ki-67 and Helios expression. (A) Expression of Ki-67 correlated with surface expression of CD71, ICOS, and ICOS-L. Representative dot plots depicting CD4+ T-cell expression of intranuclear Ki-67 and the surface markers CD71, ICOS, and ICOS-L. Data are representative of six healthy blood donors. (B) Expression of CD39 correlated with intracellular expression of Helios. Representative dot plots depicting the expression by CD4+ T cells of intracellular Helios and CD39. The expression of CD39 corresponded to intracellular expression of Helios in some donors (Bottom) but not in others (Top).
Fig. 2.
Fig. 2.
CD15s is a marker for functional FOXP3+ Treg cells. (A) CD25+CD127lowCD4+ T cells are dissected as live cells into CD45RA+CD25+ cells (a) and CD15s+CD45RACD25+ (b) or CD15sCD45RACD25+ cells (c). Expression of FOXP3 by each population is also shown. (B) Suppressive activity of FOXP3+ T-cell subpopulations prepared as shown in A. CFSE dilution by 104 CFSE-labeled CD25CD45RA+CD4+ responder T cells assessed after 84–90 h coculture with indicated cell populations at 1–1 ratio in the presence of anti-CD3 stimulation. As shown by the arrows, complete suppression is characterized by fewer proliferation cycles and decreasing amplitudes in consecutive cycle peaks, whereas ongoing proliferation is characterized by increasing amplitudes in consecutive cycle peaks (see further experimental explanations in Fig. S4). Data are representative of three independent experiments. (C) Expanding nTreg cells up-regulate CD15s in vitro. CD25CD45RA+CD4+ conventional T cells and nTreg cells were FACS isolated and cultured for 0, 7, or 14 d in the presence of anti-CD3/CD28 beads, IL-2, and rapamycin. Cells were then analyzed for the expression of CD15s and FOXP3. Data are representative of three independent experiments.
Fig. S6.
Fig. S6.
Complete suppression of effector T cell proliferation by eTreg cells. Flow cytometric analysis of CFSE dilution by human CFSE-labeled responder cells after 4 d (Top) or 6 d (Bottom) coculture with (Right) or without eTregs isolated by the previously described protocol (4) (Left). Number (and percentage) of cycling cell is indicated. In coculture of human eTregs with responder cells, proliferating responder cells could be detected on day 4, yet only a minority of them entered the third cycle of division, whereas most responder cells cultured alone had entered the third and fourth cycle. Furthermore, on day 6, most dividing responder cells cultured alone had entered the sixth or the seventh cycle of cell division. Treg-cocultured responder cells still remained halted at the third cycle, whereas decreasing amplitudes are observed in successive peaks of proliferation. This pattern of CFSE dilution in suppressed responder cells indicates that the few responder cells that have proliferated in the first few days of coculture have arrested their proliferation. Thus, human Treg cells can potently arrest the proliferation of responder cells.
Fig. 3.
Fig. 3.
CD15s expression by FOXP3-expressing thymocytes. (A) Flow cytometry analysis of FOXP3 and the indicated markers by DN, DP, and CD4 SP thymocytes. Vertical dashed lines separate FOXP3+ cells into FOXP3high and FOXP3low cells. (B) Expression of CD15s and indicated markers by FOXP3-expressing DP or CD4 SP thymocytes and peripheral FOXP3+CD4+ T cells. Data are representative of three independent experiments.
Fig. 4.
Fig. 4.
Induction of in vitro T-cell immune responses by depletion of CD15s-expressing T cells. (A) Flow cytometry analysis of CD15s and CD45RA expression by subpopulations of FOXP3+CD4+ T cells from two healthy donors before or after in vitro depletion of CD15s+ cells. (B) CD4+ T-cell responses to NY-ESO-1 peptides after CD15s+ cell depletion. CD15s+ cell-depleted or nondepleted CD4+ T cells isolated from two healthy donors as shown in A were cultured with T-cell–depleted autologous PBMCs pulsed with overlapping NY-ESO-1 peptides covering the entire sequence of NY-ESO-1 protein. IFN-γ–secreting CD4+ T-cell counts were measured by ELISpot assay. (C) CD8+ T-cell responses by the same donors to CMV peptides after CD15s+ cell depletion. PBMCs from HLA-A2+ individuals were CD15s+ cell depleted or nondepleted and cultured in the presence of 10 µM CMV 495–503 HLA-A*0201–restricted peptide for 7 d, and analyzed for the percentages of CMV tetramer-positive CD8+ T cells. Data are representative of two independent experiments.
Fig. 5.
Fig. 5.
CD15s+ eTreg cells in patients with immunological diseases. (A) Flow cytometry analysis of PBMCs gated on CD4+ T cells of a representative healthy donor and of patients with active sarcoidosis, active SLE, Sjögren syndrome, systemic sclerosis, myasthenia gravis, or untreated mycosis fungoides. Expression of CD45RA and FOXP3 on whole CD4+ T cells (Top) and of CD15s and FOXP3 on CD45RACD4+ T cells (Bottom). Numbers indicate percentage of respective populations among whole CD4+ T cells. (B) Proportions of FOXP3+ subsets among CD4+ T cells in eight healthy donors, eight patients with active sarcoidosis, and eight patients with active SLE. Mean values are in red. For comparisons and to establish statistical significance, a nonparametric Mann–Whitney u test was performed with P < 0.05 as significant. (C) Absolute counts of CD15s+ eTreg cells in eight healthy donors and the eight active SLE patients shown in B are compared using a nonparametric Mann–Whitney u test. Mean values are shown in red with P < 0.05 as significant. (D) Flow cytometry of the production of IL-2 and IFN-γ by CD4+ T cells from an active SLE patient and FOXP3+ subpopulations gated as shown after stimulation with PMA and ionomycin for 5 h. Percentages of cytokine-secreting cells are shown. Data are representative of three independent experiments.

References

    1. Sakaguchi S, Yamaguchi T, Nomura T, Ono M. Regulatory T cells and immune tolerance. Cell. 2008;133(5):775–787. - PubMed
    1. Sakaguchi S, Miyara M, Costantino CM, Hafler DA. FOXP3+ regulatory T cells in the human immune system. Nat Rev Immunol. 2010;10(7):490–500. - PubMed
    1. Allan SE, et al. Activation-induced FOXP3 in human T effector cells does not suppress proliferation or cytokine production. Int Immunol. 2007;19(4):345–354. - PubMed
    1. Miyara M, et al. Functional delineation and differentiation dynamics of human CD4+ T cells expressing the FoxP3 transcription factor. Immunity. 2009;30(6):899–911. - PubMed
    1. Ito T, et al. Two functional subsets of FOXP3+ regulatory T cells in human thymus and periphery. Immunity. 2008;28(6):870–880. - PMC - PubMed

Publication types

MeSH terms