. 2015 May 5;9(3):031101.
doi: 10.1063/1.4919807. eCollection 2015 May.

Two-dimensional and three-dimensional dynamic imaging of live biofilms in a microchannel by time-of-flight secondary ion mass spectrometry

Affiliations

Two-dimensional and three-dimensional dynamic imaging of live biofilms in a microchannel by time-of-flight secondary ion mass spectrometry

Xin Hua et al. Biomicrofluidics. .

Abstract

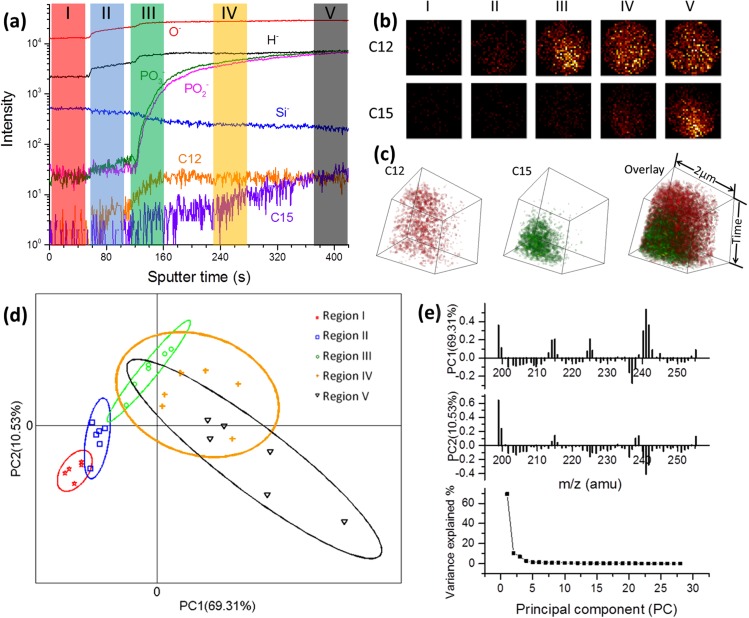
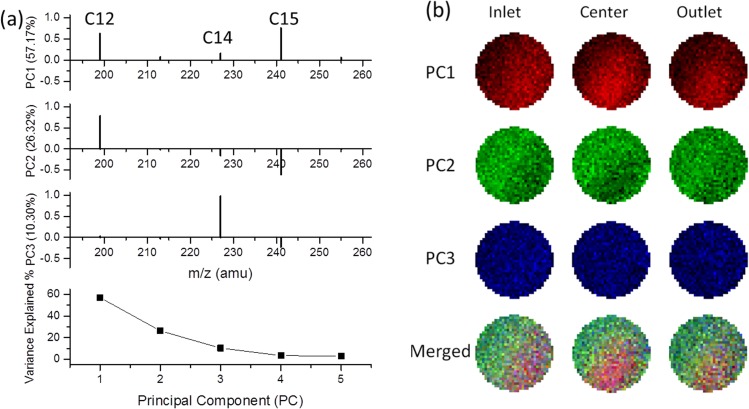
A vacuum compatible microfluidic reactor, SALVI (System for Analysis at the Liquid Vacuum Interface), was employed for in situ chemical imaging of live biofilms using time-of-flight secondary ion mass spectrometry (ToF-SIMS). Depth profiling by sputtering materials in sequential layers resulted in live biofilm spatial chemical mapping. Two-dimensional (2D) images were reconstructed to report the first three-dimensional images of hydrated biofilm elucidating spatial and chemical heterogeneity. 2D image principal component analysis was conducted among biofilms at different locations in the microchannel. Our approach directly visualized spatial and chemical heterogeneity within the living biofilm by dynamic liquid ToF-SIMS.


Figures

FIG. 1.
FIG. 1.
(a) ToF-SIMS depth profiling of the day 6 biofilm attached to the SiN membrane in the microfluidic channel. Five regions representing sample before SiN punch-through (I) during punch-through (II) or within the biofilm region (III, IV, and V) are illustrated. (b) 2D false color images of day 6 biofilm FAs at the five time regions highlighted in (a). (c) Reconstructed 3D day 6 biofilm images showing FA fragment distributions within the entire biofilm region (III–V, 302 s). The time axis represents depth profiling from near the SiN surface into the biofilm. (d) Spectra PCA score plot of day 6 biofilm showing the differences and similarities among selected five regions (m/z 199–255). A 95% confidence limit for each region was defined by an ellipse with the same color to the corresponding region clusters. (e) Loadings of PC1 and PC2 corresponding to (d) and the plot of PC variance contributions.
FIG. 2.
FIG. 2.
(a) Image PCA loading plots illustrating the contribution of each FA peak in the day 6 biofilm at three locations within the microfluidic channel. The variance contributions of each PC are shown at the bottom. (b) Reconstructed false-color 2D PCA images in RGB corresponding to each PC scores at these locations along the microfluidic channel. The RGB composite images of the three key PCs are depicted in the bottom. Only data within the 2 μm diameter circle were considered in analysis.

References

    1. Flemming H. C. and Wingender J., Nat. Rev. Microbiol. 8(9), 623–633 (2010).10.1038/nrmicro2415 - DOI - PubMed
    1. Lambert G., Bergman A., Zhang Q., Bortz D., and Austin R., New J. Phys. 16(4), 045005 (2014).10.1088/1367-2630/16/4/045005 - DOI
    1. Kim J., Hegde M., Kim S. H., Wood T. K., and Jayaraman A., Lab Chip 12(6), 1157–1163 (2012).10.1039/c2lc20800h - DOI - PubMed
    1. Yawata Y., Toda K., Setoyama E., Fukuda J., Suzuki H., Uchiyama H., and Nomura N., J. Biosci. Bioeng. 110(3), 377–380 (2010).10.1016/j.jbiosc.2010.04.002 - DOI - PubMed
    1. Holman H.-Y. N., Miles R., Hao Z., Wozei E., Anderson L. M., and Yang H., Anal. Chem. 81(20), 8564–8570 (2009).10.1021/ac9015424 - DOI - PubMed

LinkOut - more resources