. 2014 Oct 1:1:14039.
doi: 10.1038/mtm.2014.39. eCollection 2014.

AAV8-mediated Sirt1 gene transfer to the liver prevents high carbohydrate diet-induced nonalcoholic fatty liver disease

Affiliations

AAV8-mediated Sirt1 gene transfer to the liver prevents high carbohydrate diet-induced nonalcoholic fatty liver disease

Laia Vilà et al. Mol Ther Methods Clin Dev. .

Abstract

Nonalcoholic fatty liver disease (NAFLD) is the most common hepatic disease worldwide, and evidence suggests that it promotes insulin resistance and type 2 diabetes. Caloric restriction (CR) is the only available strategy for NAFLD treatment. The protein deacetylase Sirtuin1 (SIRT1), which is activated by CR, increases catabolic metabolism and decreases lipogenesis and inflammation, both involved in the development of NAFLD. Here we show that adeno-associated viral vectors of serotype 8 (AAV8)-mediated liver-specific Sirt1 gene transfer prevents the development of NAFLD induced by a high carbohydrate (HC) diet. Long-term hepatic SIRT1 overexpression led to upregulation of key hepatic genes involved in β-oxidation, prevented HC diet-induced lipid accumulation and reduced liver inflammation. AAV8-Sirt1-treated mice showed improved insulin sensitivity, increased oxidative capacity in skeletal muscle and reduced white adipose tissue inflammation. Moreover, HC feeding induced leptin resistance, which was also attenuated in AAV8-Sirt1-treated mice. Therefore, AAV-mediated gene transfer to overexpress SIRT1 specifically in the liver may represent a new gene therapy strategy to counteract NAFLD and related diseases such as type 2 diabetes.


Figures

Figure 1
Figure 1
Systemic administration of AAV8-hAAT-Sirt1 vectors led to specific SIRT1 overexpression in the liver. (a) A representative Western blot and its quantification are shown for SIRT1 in the liver, skeletal muscle (Skm), and epididymal white adipose tissue (eWAT) of mice fed with a high carbohydrate (HC) diet and treated with AAV8-hAAT-Null (AAV8-Null) or AAV8-hAAT-Sirt1 vectors (AAV8-Sirt1) at a dose of 5 × 1011 vg/mice for 15 weeks. (b) SIRT1 deacetylation activity in liver crude nuclear extracts. (c) Representative western blot and quantification of Acetyl-p53-Lys379 protein levels in nuclear fractions from livers of AAV8-Null- and AAV8-Sirt1–treated mice, using tubulin as a loading control. All analyses were performed after 15 weeks on HC diet. Data represent the mean ± SEM of at least four animals per group. **P < 0.01 and ***P < 0.001 versus AAV8-Null. a.u., arbitrary units.
Figure 2
Figure 2
AAV8-Sirt1–treated mice showed reduced hepatic lipid accumulation when fed a high carbohydrate diet. (a) Representative sections of the liver from AAV8-Null- and AAV8-Sirt1–treated mice fed with a high carbohydrate (HC) diet stained with hematoxylin-eosin. Original magnification ×100. (b) Liver triglyceride content. (c) Liver weight (d) Expression levels of Peroxisome proliferative activated receptor, gamma, coactivator 1 α (Ppargc1α), Nuclear respiratory factor 1 (Nrf1), Medium-chain acyl-Coenzyme A dehydrogenase (Acadm), Long-chain acyl-Coenzyme A dehydrogenase (Acadl), Very long chain acyl-CoA dehydrogenase (Acadvl), Carnitinepalmitoyltransferase 2 (Cpt2), Sirtuin 6 (Sirt6), Sirtuin 3 (Sirt3), and Sirtuin 4 (Sirt4) were analyzed in the liver of AAV8-Null and AAV8-Sirt1 mice. (e) Representative western blot and quantification of hepatic PPARGC1a protein levels of AAV8-Null and AAV8-Sirt1 mice, using tubulin as a loading control. All analyses were performed after 15 weeks on HC diet. Data represent the mean ± SEM of at least four animals per group. *P < 0.05 and **P < 0.01 versus AAV8-Null.
Figure 3
Figure 3
Lower macrophage infiltration and inflammation in the liver of AAV8-Sirt1–treated mice fed a high carbohydrate (HC) diet. (a) Immunostaining against MAC-2 (brown) in the liver of AAV8-Null and AAV8-Sirt1 mice. Original magnification ×100 and ×400 (insets). Red arrows indicate MAC-2+ cells. (b) Cd68, F4/80, Interleukin 1β (Il1b) and Chemokine (C-C motif) ligand 5 (Ccl5) mRNA expression levels in the liver of AAV8-Null and AAV8-Sirt1 mice. (c) Serum alanine transaminase (ALT) levels in AAV8-Null and AAV8-Sirt1 mice. All analyses were performed after 15 weeks on HC diet. Data represent the mean ± SEM of at least four animals per group. *P < 0.05 versus AAV8-Null.
Figure 4
Figure 4
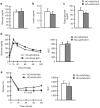
AAV8-Sirt1–treated mice were protected against insulin resistance induced by a high carbohydrate (HC) diet. (a) Blood glucose and (b) insulin levels in fed conditions are shown. (c) Fasted glucose levels. (d) Glucose tolerance was determined in fasted mice after an intraperitoneal injection of glucose (1 g/kg body weight), and blood glucose levels were measured at the indicated time points. On the right, area under the curve (AUC) of the glucose tolerance test was calculated. (e) Insulin sensitivity was determined after an intraperitoneal injection of insulin (0.75 units/kg body weight). Results are calculated as the percentage of initial blood glucose levels. Area under the curve (AUC) of the insulin tolerance test was calculated. All analyses were performed after 15 weeks on HC diet. Data represent the mean ± SEM of at least eight animals per group. *P < 0.05 versus AAV8-Null.
Figure 5
Figure 5
AAV8-Sirt1–treated mice showed increased β-oxidation capacity in skeletal muscle. (a) Triglyceride content in skeletal muscle. (b) Expression levels of Mitochondrial uncoupling protein 2 (Ucp2), Mitochondrial uncoupling protein 3 (Ucp3), Peroxisome proliferator activated receptor α (Pparα), Peroxisome proliferator activated receptor δ (Ppard), Carnitinepalmitoyltransferase 2 (Cpt2), Carnitinepalmitoyltransferase 1 (mCpt1), Peroxisome proliferative activated receptor, gamma, coactivator 1 α (Ppargc1α), and Pyruvate deshydrogenase kinase isoenzyme 4 (Pdk4). (c) Representative western blots and quantifications are shown for total AMP protein kinase (AMPKtot), phosphorylated AMPK (AMPK-P), phosphorylated Acetyl-CoA Carboxylase (ACC-P) and tubulin protein levels in skeletal muscle of AAV8-Null and AAV8-Sirt1 mice. Tubulin was used as a loading control. All analyses were performed after 15 weeks on HC diet. Data represent the mean ± SEM of at least four animals per group. *P < 0.05 and **P < 0.01 versus AAV8-Null. a.u., arbitrary units.
Figure 6
Figure 6
Reduced adipocyte size and inflammation in epididymal white adipose tissue of AAV8-Sirt1–treated mice. (a) Epididymal white adipose tissue (eWAT) weight. (b) Representative sections of eWAT, stained with hematoxylin-eosin. Original magnification ×100. (c) Mean adipocyte area. (d) Frequency distribution of adipocyte area. (e) Leptin (Lep), Adiponectin (Adipoq), Chemokine (C-C motif) Ligand 2 (Ccl2), Inducible Nitric Oxide Synthase 2 (Nos2), F4/80, Tumour necrosis factor α (Tnfα), Interleukin 10 (Il10), and Hypoxia Inducible Factor 1a (Hif1a) expression levels in eWAT. (f) Serum leptin and adiponectin levels. All analyses were performed after 15 weeks on HC diet. Data represent the mean ± SEM of at least four animals per group. *P < 0.05 versus AAV8-Null.
Figure 7
Figure 7
Hepatic SIRT1 overexpression counteracts the development of leptin resistance induced by a high carbohydrate diet. (a) Representative western blots and quantifications are shown for the active and phosphorylated form of Signal Transducer and Activator of Transcription 3 at the Serine 727 residue (STAT3-PSer727), phosphorylated mitogen-activated protein kinase ERK1/2 (ERK1/2-P), total ERK1/2 (ERK1/2tot) and tubulin protein levels in liver of AAV8-Null and AAV8-Sirt1 mice. Tubulin was used as a loading control. Data represent the mean ± SEM of at least four animals per group. Correlation analyses between serum leptin levels and hepatic protein levels of STAT3-PSer727 (b) and serum leptin levels and the ratio AMPK-P/AMPKtot in skeletal muscle (c) in AAV8-Null and AAV8-Sirt1 mice. All analyses were performed after 15 weeks on HC diet. a.u., arbitrary units.

References

    1. Chen L, Magliano DJ, Zimmet PZ. The worldwide epidemiology of type 2 diabetes mellitus–present and future perspectives. Nat Rev Endocrinol. 2012;8:228–236. - PubMed
    1. Stefan N, Häring HU. The metabolically benign and malignant fatty liver. Diabetes. 2011;60:2011–2017. - PMC - PubMed
    1. Fruci B, Giuliano S, Mazza A, Malaguarnera R, Belfiore A. Nonalcoholic Fatty liver: a possible new target for type 2 diabetes prevention and treatment. Int J Mol Sci. 2013;14:22933–22966. - PMC - PubMed
    1. Lim JS, Mietus-Snyder M, Valente A, Schwarz JM, Lustig RH. The role of fructose in the pathogenesis of NAFLD and the metabolic syndrome. Nat Rev Gastroenterol Hepatol. 2010;7:251–264. - PubMed
    1. Rebollo A, Roglans N, Alegret M, Laguna JC. Way back for fructose and liver metabolism: bench side to molecular insights. World J Gastroenterol. 2012;18:6552–6559. - PMC - PubMed