

A low-cost sensing system for cooperative air quality monitoring in urban areas
- PMID: 26016912
- PMCID: PMC4507691
- DOI: 10.3390/s150612242
A low-cost sensing system for cooperative air quality monitoring in urban areas
Abstract
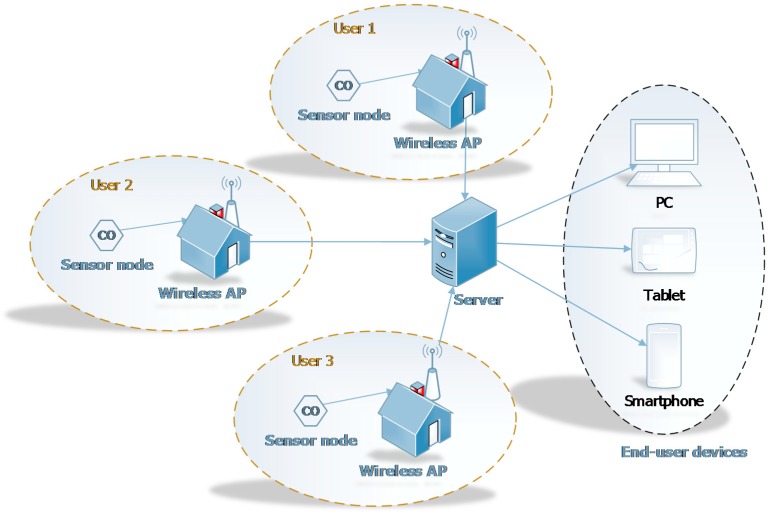
Air quality in urban areas is a very important topic as it closely affects the health of citizens. Recent studies highlight that the exposure to polluted air can increase the incidence of diseases and deteriorate the quality of life. Hence, it is necessary to develop tools for real-time air quality monitoring, so as to allow appropriate and timely decisions. In this paper, we present uSense, a low-cost cooperative monitoring tool that allows knowing, in real-time, the concentrations of polluting gases in various areas of the city. Specifically, users monitor the areas of their interest by deploying low-cost and low-power sensor nodes. In addition, they can share the collected data following a social networking approach. uSense has been tested through an in-field experimentation performed in different areas of a city. The obtained results are in line with those provided by the local environmental control authority and show that uSense can be profitably used for air quality monitoring.
Keywords: air quality monitoring; cooperative system; participatory sensing; urban sensing.
Figures

References
-
- European Environment Agency European Union emission inventory report 1990–2012 under the UNECE Convention on Long-range Transboundary Air Pollution (LRTAP) Jun, 2014. [(accessed on 21 January 2015)]. Available online: http://www.eea.europa.eu/publications/lrtap-2014.
-
- United States Environmental Protection Agency 1970–2013 Average annual emissions, all criteria pollutants in MS Excel., February 2014. [(accessed on 21 January 2015)]; Available online: http://www.epa.gov/ttn/chief/trends/trends06/national_tier1_caps.xlsx.
-
- European Environment Agency Air quality in Europe—2014 Report. Nov, 2014. [(accessed on 21 January 2015)]. Available online: http://www.eea.europa.eu/publications/air-quality-in-europe-2014.
-
- Rana R., Chou C.T., Bulusu N., Kanhere S., Hu W. Ear-Phone: A context-aware noise mapping using smart phones. Pervasive Mobile Comput. 2015;17:1–22. doi: 10.1016/j.pmcj.2014.02.001. - DOI
Publication types
MeSH terms
Substances
LinkOut - more resources
Full Text Sources
Other Literature Sources
