. 2015 Sep;17(5):1246-54.
doi: 10.1208/s12248-015-9784-y. Epub 2015 May 28.

A Method to Evaluate Fetal Erythropoiesis from Postnatal Survival of Fetal RBCs

Affiliations

A Method to Evaluate Fetal Erythropoiesis from Postnatal Survival of Fetal RBCs

Denison J Kuruvilla et al. AAPS J. 2015 Sep.

Abstract

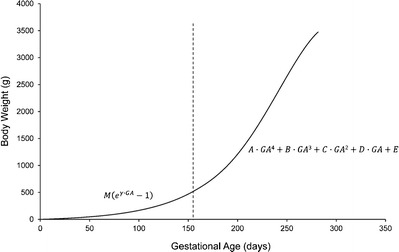
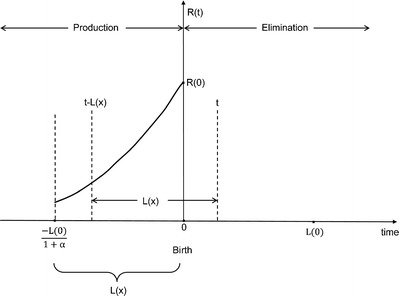
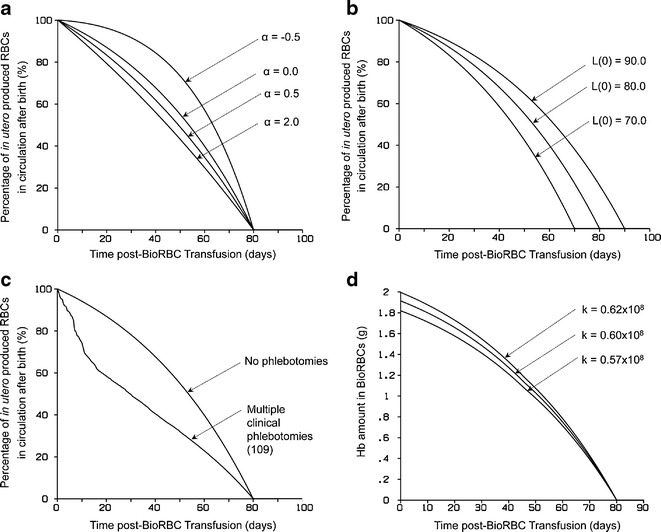
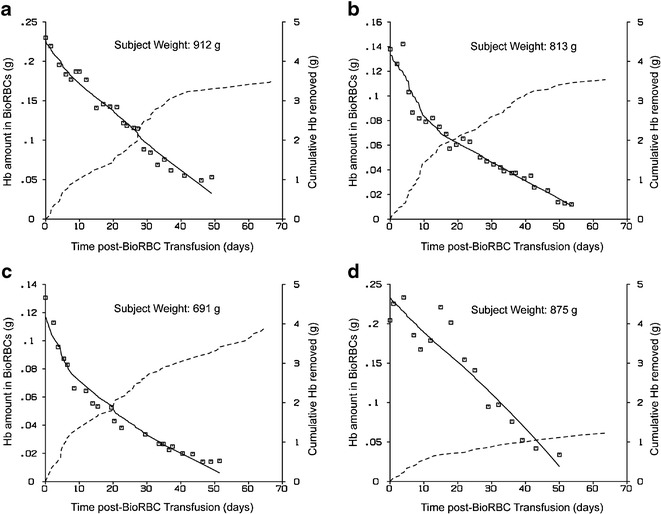
Fetal RBCs are produced during a period of very rapid growth and stimulated erythropoiesis under hypoxic intrauterine conditions. Fetal RBC life span varies with gestational age (GA) and is shorter than that in healthy adults. Due to the special kinetic properties of life span-based survival of human RBCs, a mathematical model-based kinetic analysis of the survival of fetal RBCs shortly after birth provides a unique opportunity to "look backward in time" to evaluate fetal erythropoiesis. This work introduces a novel method that utilizes postnatal in vivo RBC survival data collected within 2 days after birth to study both nonsteady-state (non-SS) in utero RBC production and changing fetal RBC life span over time. The effect of changes in erythropoiesis rate and RBC life span and the effect of multiple postnatal phlebotomies on the RBC survival curves were investigated using model-based simulations. This mathematical model, which considers both changes in the rate of erythropoiesis and RBC life span and which accurately accounts for the confounding effect of multiple phlebotomies, was applied to survival curves for biotin-labeled RBCs from ten anemic very low birth weight preterm infants. The estimated mean fetal RBC production rate scaled by body weight was 1.07 × 10(7) RBCs/day g, and the mean RBC life span at birth was 52.1 days; these values are consistent with reported values. The in utero RBC life span increased at a rate of 0.51 days per day of gestation. We conclude that the proposed mathematical model and its implementation provide a flexible framework to study in utero non-SS fetal erythropoiesis in newborn infants.


Figures

Fig. 1
Fig. 1
Intrauterine growth of newborn infants. The birth weight vs. GA data (50th birth weight percentile) extracted from Arbuckle et al. (13) was used to approximate the intrauterine growth for male singleton, female singleton, male twin, and female twin infants. For GA greater than 154 days (dashed line), each dataset was separately fitted with a fourth-order polynomial function (Eq. 1). For GA less than that included in this birth cohort, i.e., less than 154 days, an exponential function (Eq. 1) was used for extrapolation of intrauterine growth. The values of parameters A, B, C, D, E, M, and γ are listed in Table I
Fig. 2
Fig. 2
Non-SS fetal erythropoiesis in newborn infants. The solid line represents the changes in fetal erythropoiesis rate up to the time of birth. R(0) represents the RBC production rate at time of birth (t = 0). The fetal erythropoiesis rate is proportional to the in utero infant body weight (Eq. 2). Fetal RBC life span, L(x), varies linearly with time (Eq. 3)
Fig. 3
Fig. 3
Model simulated cord blood RBC survival curves. a The effect of varying α (Eq. 5), on the simulated RBC survival curve. All other model parameters were fixed at specified values (L(0) = 80 days, k = 0.60 × 108 RBCs/day g with no clinical phlebotomies). b The effect of varying L(0) on the simulated RBC survival curve (α = 0.0, k = 0.60 × 108 RBCs/day g with no clinical phlebotomies). c The effect of multiple clinical phlebotomies on the simulated RBC survival curve (L(0) = 80 days, k = 0.60 × 108 RBCs/day g and α = 0.0). The effect of varying k on the model-predicted RBC survival curve can be observed in d (α = 0.0, L(0) = 80 days with no clinical phlebotomies)
Fig. 4
Fig. 4
ad Model fit to Hb amount-time data for four subjects. The open squares represent Hb amount data points and the solid line shows the model fit (Eq. 10). The dashed line represents the cumulative amount of Hb removed from the infant during the same time interval

References

    1. Kett JC. Anemia in infancy. Pediatr Rev. 2012;33(4):186–7. doi: 10.1542/pir.33-4-186. - DOI - PubMed
    1. Kaplan E, Hsu KS. Determination of erythrocyte survival in newborn infants by means of Cr51-labelled erythrocytes. Pediatrics. 1961;27(3):354–61. - PubMed
    1. Sturgeon P. Volumetric and microscopic pattern of bone marrow in normal infants and children: II. Cytologic pattern. Pediatrics. 1951;7(5):642–50. - PubMed
    1. Bratteby L-E, Garby L, Wadman B. Studies on erythro-kinetics in infancy: XIII. The mean life span and the life span frequency function of red blood cells formed during foetal life. Acta Paediatr. 1968;57(4):305–10. doi: 10.1111/j.1651-2227.1968.tb07298.x. - DOI - PubMed
    1. Palis J, Segel G. Developmental biology of erythropoiesis. Blood Rev. 1998;12(2):106–14. doi: 10.1016/S0268-960X(98)90022-4. - DOI - PubMed

Publication types

LinkOut - more resources