. 2015 May 28:5:9886.
doi: 10.1038/srep09886.

Bilirubin Increases Insulin Sensitivity by Regulating Cholesterol Metabolism, Adipokines and PPARγ Levels

Affiliations

Bilirubin Increases Insulin Sensitivity by Regulating Cholesterol Metabolism, Adipokines and PPARγ Levels

Jinfeng Liu et al. Sci Rep. .

Erratum in

Abstract

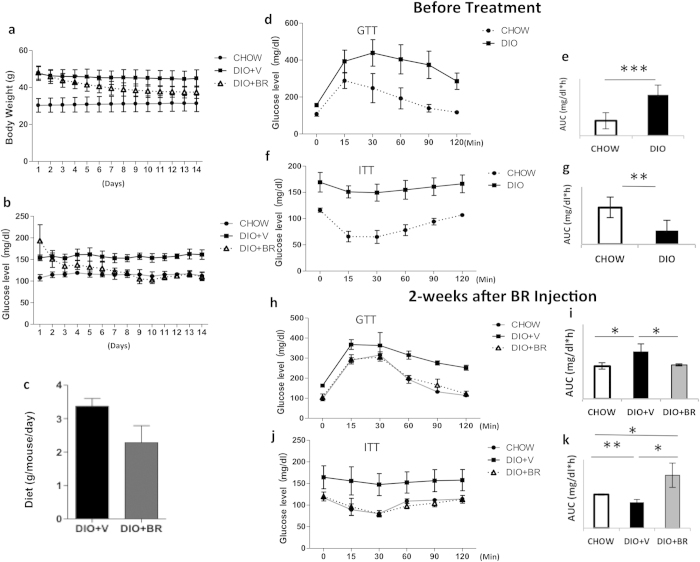
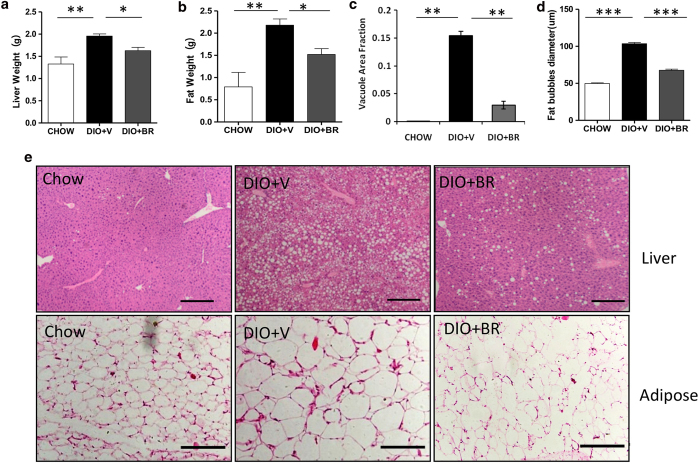
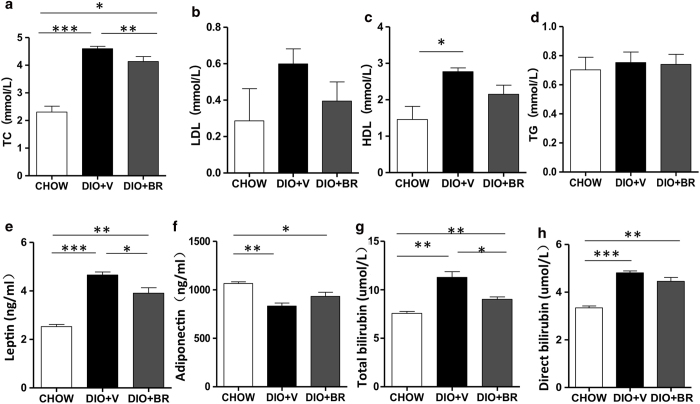
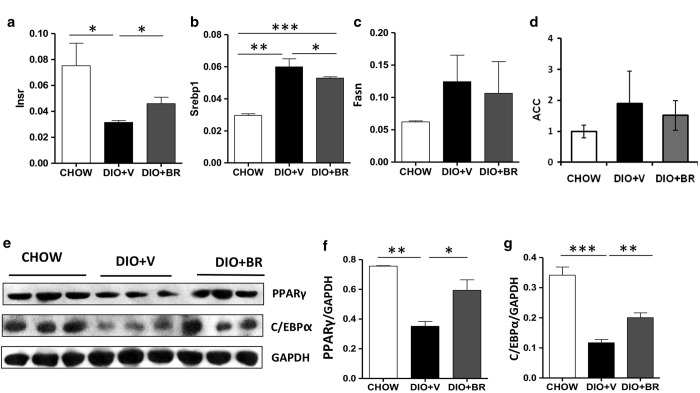
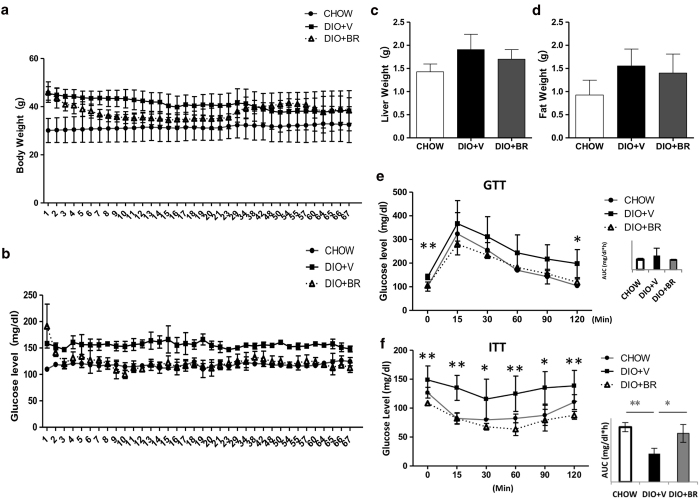
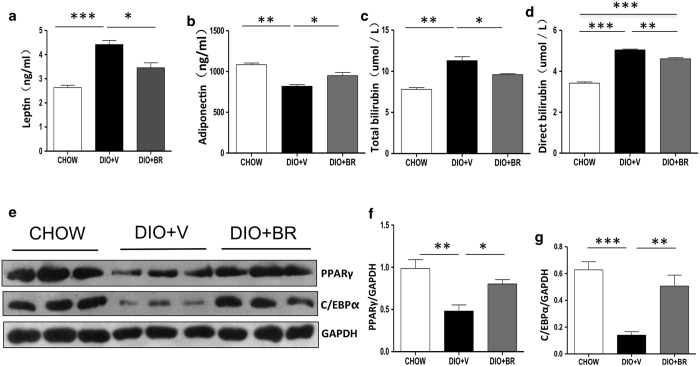
Obesity can cause insulin resistance and type 2 diabetes. Moderate elevations in bilirubin levels have anti-diabetic effects. This study is aimed at determining the mechanisms by which bilirubin treatment reduces obesity and insulin resistance in a diet-induced obesity (DIO) mouse model. DIO mice were treated with bilirubin or vehicle for 14 days. Body weights, plasma glucose, and insulin tolerance tests were performed prior to, immediately, and 7 weeks post-treatment. Serum lipid, leptin, adiponectin, insulin, total and direct bilirubin levels were measured. Expression of factors involved in adipose metabolism including sterol regulatory element-binding protein (SREBP-1), insulin receptor (IR), and PPARγ in liver were measured by RT-PCR and Western blot. Compared to controls, bilirubin-treated mice exhibited reductions in body weight, blood glucose levels, total cholesterol (TC), leptin, total and direct bilirubin, and increases in adiponectin and expression of SREBP-1, IR, and PPARγ mRNA. The improved metabolic control achieved by bilirubin-treated mice was persistent: at two months after treatment termination, bilirubin-treated DIO mice remained insulin sensitive with lower leptin and higher adiponectin levels, together with increased PPARγ expression. These results indicate that bilirubin regulates cholesterol metabolism, adipokines and PPARγ levels, which likely contribute to increased insulin sensitivity and glucose tolerance in DIO mice.


Figures

Figure 1
Figure 1. Administration of bilirubin reduces body weight and increases insulin sensitivity in DIO mice.
(a) Changes in body weights of DIO mice treated with bilirubin (DIO + BR) or vehicle (DIO + V) compared to control mice fed standard diet (CHOW). (b) Daily non-fasting blood glucose levels in DIO + BR, DIO + V, and CHOW mice during bilirubin treatment. (c) Average food intake per mouse per 24-h period in DIO mice receiving BR or vehicle. (d) Intraperitoneal glucose tolerance test (GTT) of DIO mice and CHOW controls before bilirubin treatment; (e) area under the curve of GTT. (f) Insulin tolerance test (ITT) of DIO mice and CHOW mice before bilirubin treatment; (g) reverse area under the baseline above curve. (h) GTT of DIO + BR, DIO + V, and CHOW mice 14 days after the first bilirubin injection; (i) area under the curve. (j) ITT of DIO + BR, DIO + V, and CHOW mice at 14 days after the first bilirubin injection; (k) reverse area under the baseline above curve. At least 6-8 mice were included in each group; **p < 0.01, *p < 0.05, Student’s t test. DIO + BR: DIO mice treated with bilirubin; DIO + V: DIO mice treated with vehicle; CHOW: mice fed standard diet.
Figure 2
Figure 2. Bilirubin treatment reduces liver and fat weights by reducing adiposity 14 days after initiating bilirubin treatment.
(a) Liver weights of DIO + BR, DIO + V, and CHOW mice. (b) Epididymal fat weights of DIO + BR, DIO + V, and CHOW mice. (c) Vacuole area fractions in livers of DIO + BR, DIO + V, or CHOW mice. (d) Fat bubble diameters (μm) of epididymal adipocytes of DIO + BR, DIO + V, or CHOW. (e) Representative micrographs of H&E staining of liver and adipose tissue sections from DIO + BR, DIO + V, and CHOW mice. Scale bar = 200 μm. At least 3 mice were analyzed in each group; *p < 0.05, Student’s t test. Data are mean ± standard deviation.
Figure 3
Figure 3. Bilirubin therapy alters cholesterol and adipokine levels in DIO mice at 14 days post treatment.
Serum levels of TC (a), LDL (b), HDL (c), TG (d), leptin (e), adiponectin (f), total bilirubin (g), and direct bilirubin (h) in DIO + BR, DIO + V, or CHOW mice were measured in serum immediately after completing bilirubin treatment. Each group contained 3-4 mice; Data are mean ± standard deviation; ***p < 0.001, **p < 0.01, and *p < 0.05, Student’s t test.
Figure 4
Figure 4. Bilirubin promotes expression of genes related to obesity and insulin resistance in liver 14 days post treatment.
Relative mRNA expression of insulin receptor (Insr) (a), SREBP-1 (b), Fasn (c) and ACC (d) in livers of DIO + BR, DIO + V, and CHOW mice as measured by RT-PCR analysis. Values represent relative expression of target gene compared to expression of endogenous control. (e) Expression of PPARγ and C/EBPα protein determined in liver from DIO + BR, DIO + V, and CHOW mice by Western blot analysis. Gels had been run under same experimental conditions and cropped blots are shown. (f) Relative protein expression of PPARγ and (g) C/EBPα relative to glyceraldehyde 3-phosphate dehydrogenase (GAPDH) control (NIH ImageJ software). Samples from 3 individual mice were analyzed. Data are mean ± standard deviation; ***p < 0.001, **p < 0.01 and *p < 0.05, Student’s t test.
Figure 5
Figure 5. The insulin sensitizing effects of bilirubin persists 7 weeks after completion of bilirubin treatment.
(a) Body weight of DIO + BR, DIO + V, and CHOW mice during the 9-week experiment. (b) Serum glucose levels in DIO + BR, DIO + V, and CHOW mice during the 9-week experiment. Liver (c) and epididymal fat weights (d) measured 7 weeks after treatment completion. (e) (left) GTT of DIO mice measured 7 weeks after treatment completion; (right) values of area under the curve above baseline; (f) (left) ITT of DIO mice measured 7 weeks after treatment completion; (right) values of reverse area above the curve under baseline. At least 3 mice were included in each group. Data are mean ± standard deviation; ***p < 0.001, **p < 0.01, *p < 0.05, Student’s t test.
Figure 6
Figure 6. Gene expression in liver 7 weeks after completion of bilirubin treatment.
Serum leptin (a), adiponectin (b), total bilirubin (c), and direct bilirubin (d) levels were measured in liver 7 weeks after completing bilirubin injection in DIO + BR, DIO + V, and CHOW mice. (e) Expression of PPARγ and C/EBPα protein determined in liver from DIO + BR, DIO + V, and CHOW mice by Western blot. (f) Relative protein expression of PPARγ and (g) C/EBPα relative to glyceraldehyde 3-phosphate dehydrogenase (GAPDH) control. Samples from 3 individual mice were analyzed. Data are mean ± standard deviation; ***p < 0.001, **p < 0.01 and *p < 0.05, Student’s t test.

References

    1. Lee J. M., Okumura M. J., Davis M. M., Herman W. H. & Gurney J. G. Prevalence and determinants of insulin resistance among U.S. adolescents: a population-based study. Diabetes Care 29, 2427–2432 (2006). - PubMed
    1. Masuo K., Rakugi H., Ogihara T., Esler M. D. & Lambert G. W. Cardiovascular and renal complications of type 2 diabetes in obesity: role of sympathetic nerve activity and insulin resistance. Curr Diabetes Rev 6, 58–67 (2010). - PubMed
    1. Chu N. F. et al. Plasma insulin, leptin, and soluble TNF receptors levels in relation to obesity-related atherogenic and thrombogenic cardiovascular disease risk factors among men. Atherosclerosis 157, 495–503 (2001). - PubMed
    1. Kahn B. B. & Flier J. S. Obesity and insulin resistance. J Clin Invest 106, 473–481 (2000). - PMC - PubMed
    1. Li M. et al. Treatment of obese diabetic mice with a heme oxygenase inducer reduces visceral and subcutaneous adiposity, increases adiponectin levels, and improves insulin sensitivity and glucose tolerance. Diabetes 57, 1526–1535 (2008). - PubMed

Publication types

MeSH terms