

Validation of Normalizations, Scaling, and Photofading Corrections for FRAP Data Analysis
- PMID: 26017223
- PMCID: PMC4446327
- DOI: 10.1371/journal.pone.0127966
Validation of Normalizations, Scaling, and Photofading Corrections for FRAP Data Analysis
Abstract
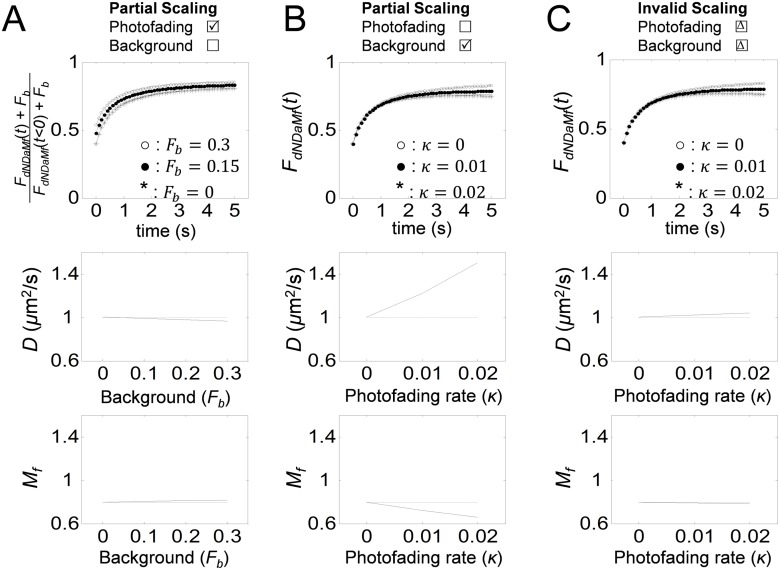
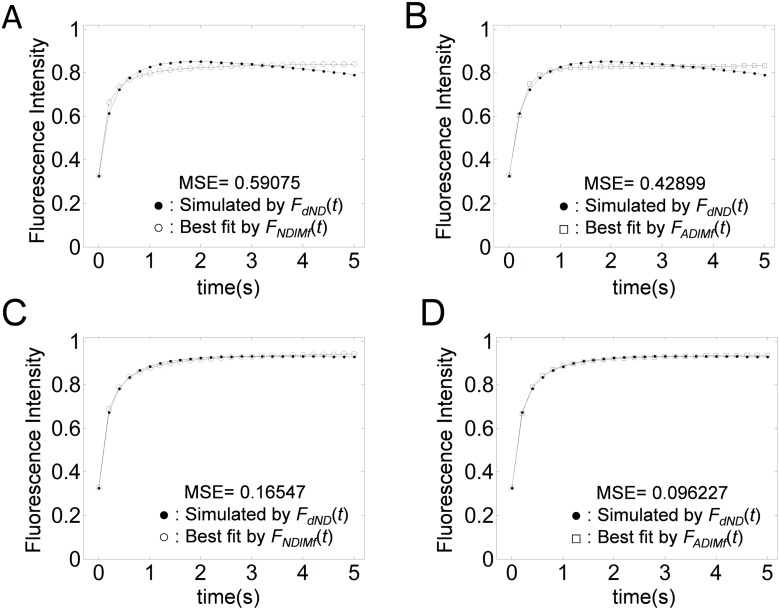
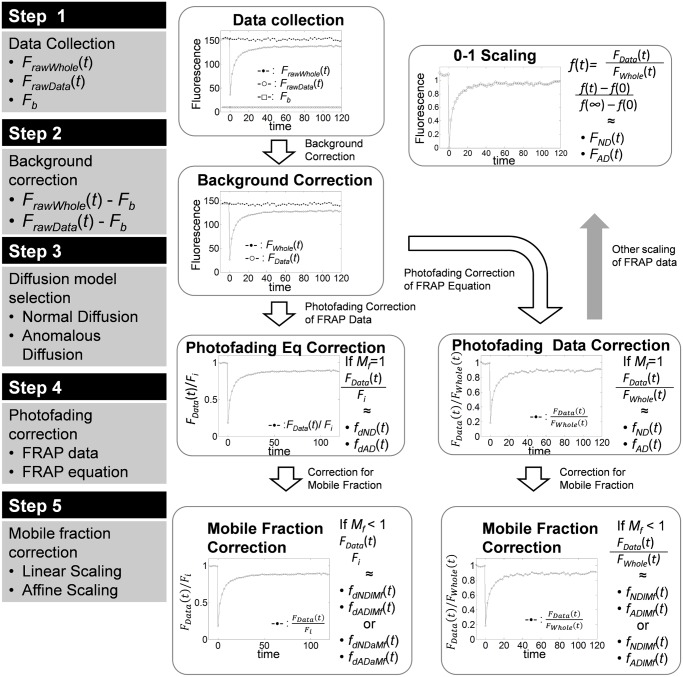
Fluorescence Recovery After Photobleaching (FRAP) has been a versatile tool to study transport and reaction kinetics in live cells. Since the fluorescence data generated by fluorescence microscopy are in a relative scale, a wide variety of scalings and normalizations are used in quantitative FRAP analysis. Scaling and normalization are often required to account for inherent properties of diffusing biomolecules of interest or photochemical properties of the fluorescent tag such as mobile fraction or photofading during image acquisition. In some cases, scaling and normalization are also used for computational simplicity. However, to our best knowledge, the validity of those various forms of scaling and normalization has not been studied in a rigorous manner. In this study, we investigate the validity of various scalings and normalizations that have appeared in the literature to calculate mobile fractions and correct for photofading and assess their consistency with FRAP equations. As a test case, we consider linear or affine scaling of normal or anomalous diffusion FRAP equations in combination with scaling for immobile fractions. We also consider exponential scaling of either FRAP equations or FRAP data to correct for photofading. Using a combination of theoretical and experimental approaches, we show that compatible scaling schemes should be applied in the correct sequential order; otherwise, erroneous results may be obtained. We propose a hierarchical workflow to carry out FRAP data analysis and discuss the broader implications of our findings for FRAP data analysis using a variety of kinetic models.
Conflict of interest statement
Figures
Similar articles
-
Analysis of Protein Kinetics Using Fluorescence Recovery After Photobleaching (FRAP).Methods Mol Biol. 2017;1563:243-267. doi: 10.1007/978-1-4939-6810-7_16. Methods Mol Biol. 2017. PMID: 28324613
-
A generalization of theory for two-dimensional fluorescence recovery after photobleaching applicable to confocal laser scanning microscopes.Biophys J. 2009 Sep 2;97(5):1501-11. doi: 10.1016/j.bpj.2009.06.017. Biophys J. 2009. PMID: 19720039 Free PMC article.
-
Confocal fluorescence recovery after photobleaching of green fluorescent protein in solution.J Fluoresc. 2006 Jan;16(1):87-94. doi: 10.1007/s10895-005-0019-y. Epub 2006 Jan 6. J Fluoresc. 2006. PMID: 16397826
-
FRAP analysis of binding: proper and fitting.Trends Cell Biol. 2005 Feb;15(2):84-91. doi: 10.1016/j.tcb.2004.12.001. Trends Cell Biol. 2005. PMID: 15695095 Review.
-
Quantitative measurement of intracellular protein dynamics using photobleaching or photoactivation of fluorescent proteins.Microscopy (Oxf). 2014 Dec;63(6):403-8. doi: 10.1093/jmicro/dfu033. Epub 2014 Sep 28. Microscopy (Oxf). 2014. PMID: 25268018 Review.
Cited by
-
Direct determination of oligomeric organization of integral membrane proteins and lipids from intact customizable bilayer.Nat Methods. 2023 Jun;20(6):891-897. doi: 10.1038/s41592-023-01864-5. Epub 2023 Apr 27. Nat Methods. 2023. PMID: 37106230 Free PMC article.
-
PIM1 controls GBP1 activity to limit self-damage and to guard against pathogen infection.Science. 2023 Oct 6;382(6666):eadg2253. doi: 10.1126/science.adg2253. Epub 2023 Oct 6. Science. 2023. PMID: 37797010 Free PMC article.
-
A Highly Accurate Pixel-Based FRAP Model Based on Spectral-Domain Numerical Methods.Biophys J. 2019 Apr 2;116(7):1348-1361. doi: 10.1016/j.bpj.2019.02.023. Epub 2019 Mar 1. Biophys J. 2019. PMID: 30878198 Free PMC article.
-
Molecular definition of the endogenous Toll-like receptor signalling pathways.Nature. 2024 Jul;631(8021):635-644. doi: 10.1038/s41586-024-07614-7. Epub 2024 Jul 3. Nature. 2024. PMID: 38961291
-
Use of Fluorescence Recovery After Photobleaching (FRAP) to Measure In Vivo Dynamics of Cell Junction-Associated Polarity Proteins.Methods Mol Biol. 2022;2438:1-30. doi: 10.1007/978-1-0716-2035-9_1. Methods Mol Biol. 2022. PMID: 35147932
References
Publication types
MeSH terms
Substances
LinkOut - more resources
Full Text Sources
Other Literature Sources
Research Materials
Miscellaneous
