

Patient-reported outcomes in a large community-based pain medicine practice: evaluation for use in phenotype modeling
- PMID: 26017305
- PMCID: PMC4446111
- DOI: 10.1186/s12911-015-0164-4
Patient-reported outcomes in a large community-based pain medicine practice: evaluation for use in phenotype modeling
Abstract
Background: An academic, community medicine partnership was established to build a phenotype-to-outcome model targeting chronic pain. This model will be used to drive clinical decision support for pain medicine in the community setting. The first step in this effort is an examination of the electronic health records (EHR) from clinics that treat chronic pain. The biopsychosocial components provided by both patients and care providers must be of sufficient scope to populate the spectrum of patient types, treatment modalities, and possible outcomes.
Methods: The patient health records from a large Midwest pain medicine practice (Michigan Pain Consultants, PC) contains physician notes, administrative codes, and patient-reported outcomes (PRO) on over 30,000 patients during the study period spanning 2010 to mid-2014. The PRO consists of a regularly administered Pain Health Assessment (PHA), a biopsychosocial, demographic, and symptomology questionnaire containing 163 items, which is completed approximately every six months with a compliance rate of over 95%. The biopsychosocial items (74 items with Likert scales of 0-10) were examined by exploratory factor analysis and descriptive statistics to determine the number of independent constructs available for phenotypes and outcomes. Pain outcomes were examined both in the aggregate and the mean of longitudinal changes in each patient.
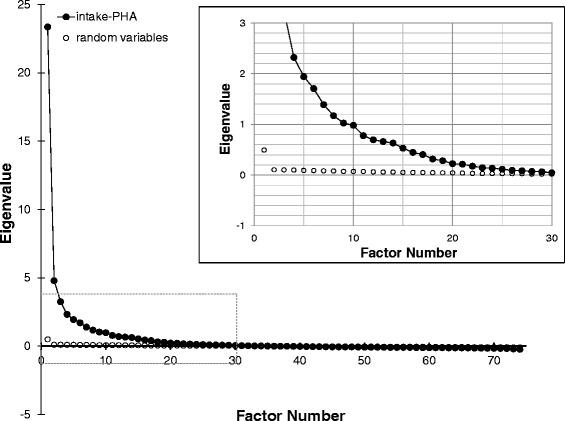
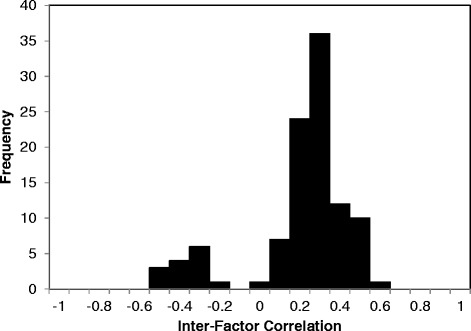
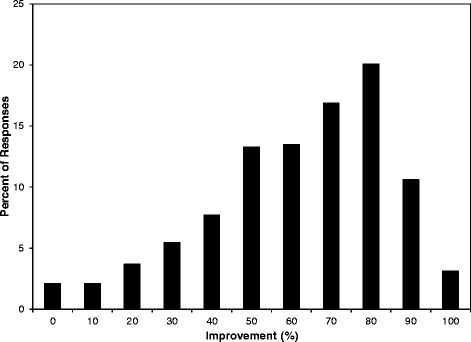
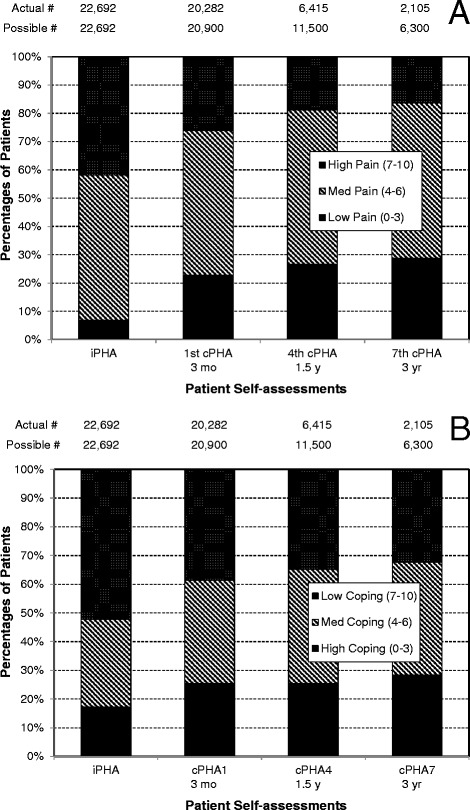
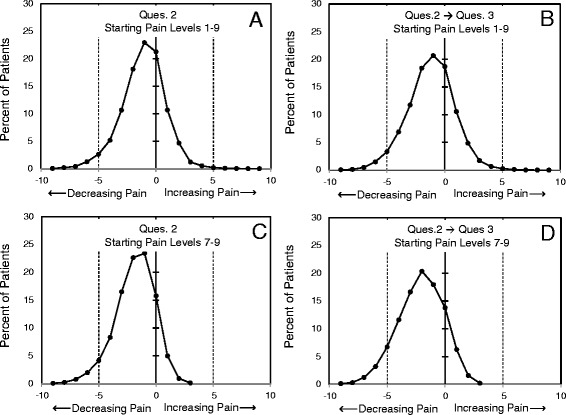
Results: Exploratory factor analysis of the intake PHA revealed 15 orthogonal factors representing pain levels; physical, social, and emotional functions; the effects of pain on these functions; vitality and health; and measures of outcomes and satisfaction. Seven items were independent of the factors, offering unique information. As an exemplar of outcomes from the follow-up PHAs, patients reported approximately 60% relief in their pain. When examined in the aggregate, patients showed both a decrease in pain levels and an increase in coping skills with an increased number of visits. When examined individually, 80-85% of patients presenting with the highest pain levels reported improvement by approximately two points on an 11-point pain scale.
Conclusions: We conclude that the data available in a community practice can be a rich source of biopsychosocial information relevant to the phenotypes of chronic pain. It is anticipated that phenotype linkages to best treatments and outcomes can be constructed from this set of records.
Figures
Similar articles
-
Use of acupuncture for pain management in an academic Korean medicine hospital: a retrospective review of electronic medical records.Acupunct Med. 2013 Jun;31(2):228-34. doi: 10.1136/acupmed-2012-010257. Epub 2013 Feb 28. Acupunct Med. 2013. PMID: 23449178
-
The effect of EHR-integrated patient-reported outcomes on satisfaction with chronic pain care.Am J Manag Care. 2016 Dec 1;22(12):e403-e408. Am J Manag Care. 2016. PMID: 27982672 Free PMC article. Clinical Trial.
-
Factors Influencing the Application of a Biopsychosocial Perspective in Clinical Judgement of Chronic Pain: Interactive Management with Medical Students.Pain Physician. 2017 Sep;20(6):E951-E960. Pain Physician. 2017. PMID: 28934799
-
Can assessing chronic pain outcomes data improve outcomes?Pain Med. 2013 Jun;14(6):779-91. doi: 10.1111/pme.12075. Epub 2013 Apr 9. Pain Med. 2013. PMID: 23574493 Review.
-
Clinical biopsychosocial physiotherapy assessment of patients with chronic pain: The first step in pain neuroscience education.Physiother Theory Pract. 2016 Jul;32(5):368-84. doi: 10.1080/09593985.2016.1194651. Epub 2016 Jun 28. Physiother Theory Pract. 2016. PMID: 27351769 Review.
Cited by
-
Characterizing classes of fibromyalgia within the continuum of central sensitization syndrome.J Pain Res. 2018 Oct 23;11:2551-2560. doi: 10.2147/JPR.S147199. eCollection 2018. J Pain Res. 2018. PMID: 30425566 Free PMC article.
-
Patient-reported data informing early benefit assessment of rare diseases in Germany: A systematic review.Health Econ Rev. 2019 Dec 12;9(1):34. doi: 10.1186/s13561-019-0251-9. Health Econ Rev. 2019. PMID: 31832812 Free PMC article.
-
Are pelvic adhesions associated with pain, physical, emotional and functional characteristics of women presenting with chronic pelvic pain? A cluster analysis.BMC Womens Health. 2018 Jan 8;18(1):11. doi: 10.1186/s12905-017-0509-5. BMC Womens Health. 2018. PMID: 29310639 Free PMC article.
-
Discordant patient pain level reporting between questionnaires and physician encounters of the same day.AMIA Annu Symp Proc. 2017 Feb 10;2016:667-676. eCollection 2016. AMIA Annu Symp Proc. 2017. PMID: 28269863 Free PMC article.
References
-
- Institute of Medicine: Relieving Pain in America A Blueprint for Transforming Prevention, Care, Education and Research. National Academies Press, Washington, D.C. 2011. - PubMed
-
- Manchikanti L. Evidence-based medicine, systematic reviews, and guidelines in interventional pain management, part I: introduction and general considerations. Pain Physician. 2008;11:161–86. - PubMed
Publication types
MeSH terms
Grants and funding
LinkOut - more resources
Full Text Sources
Other Literature Sources
Medical
Research Materials
