. 2015 Jun 11;522(7555):179-84.
doi: 10.1038/nature14493. Epub 2015 May 27.

Chromothripsis from DNA damage in micronuclei

Affiliations

Chromothripsis from DNA damage in micronuclei

Cheng-Zhong Zhang et al. Nature. .

Abstract

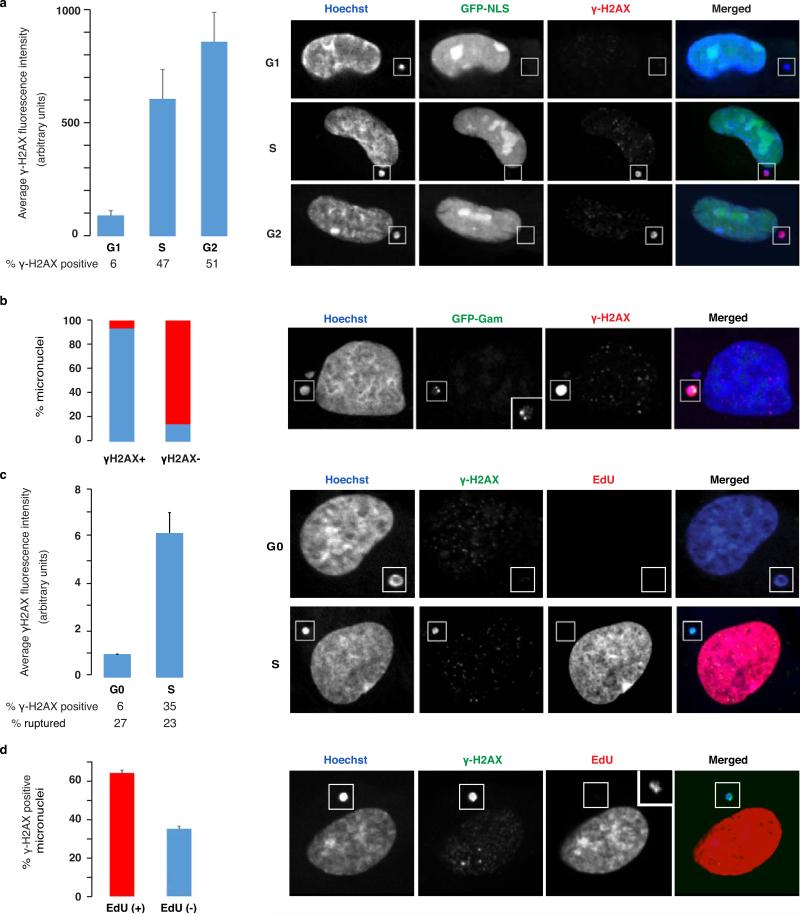
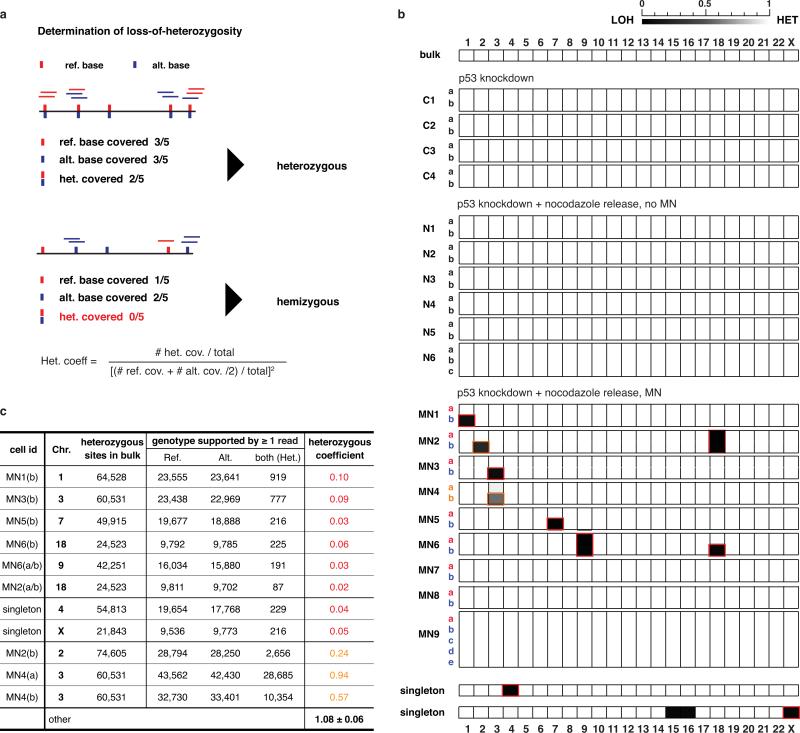
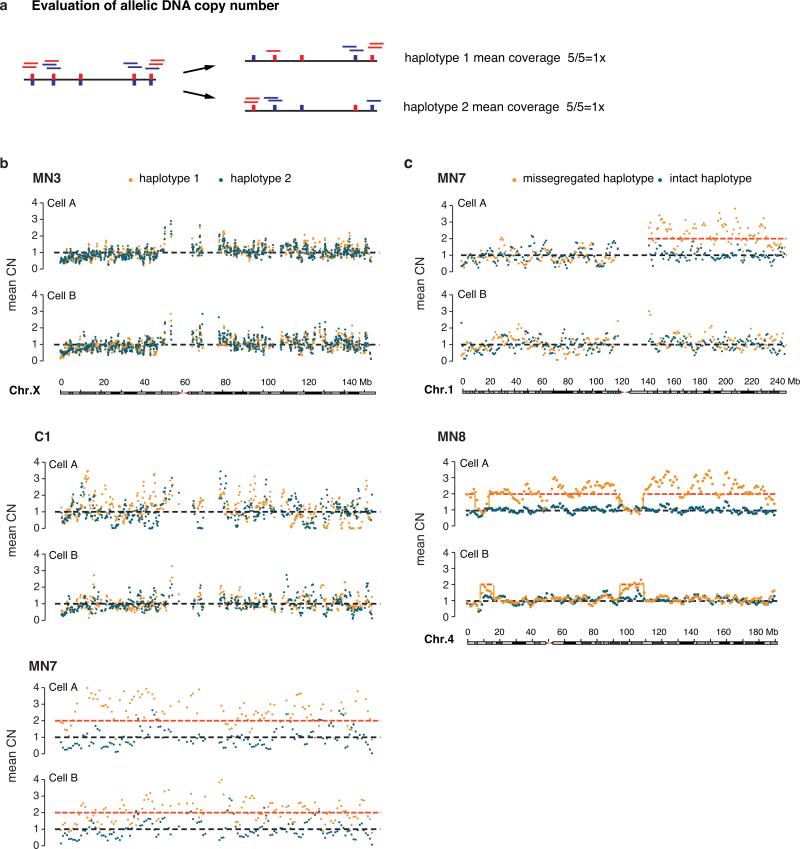
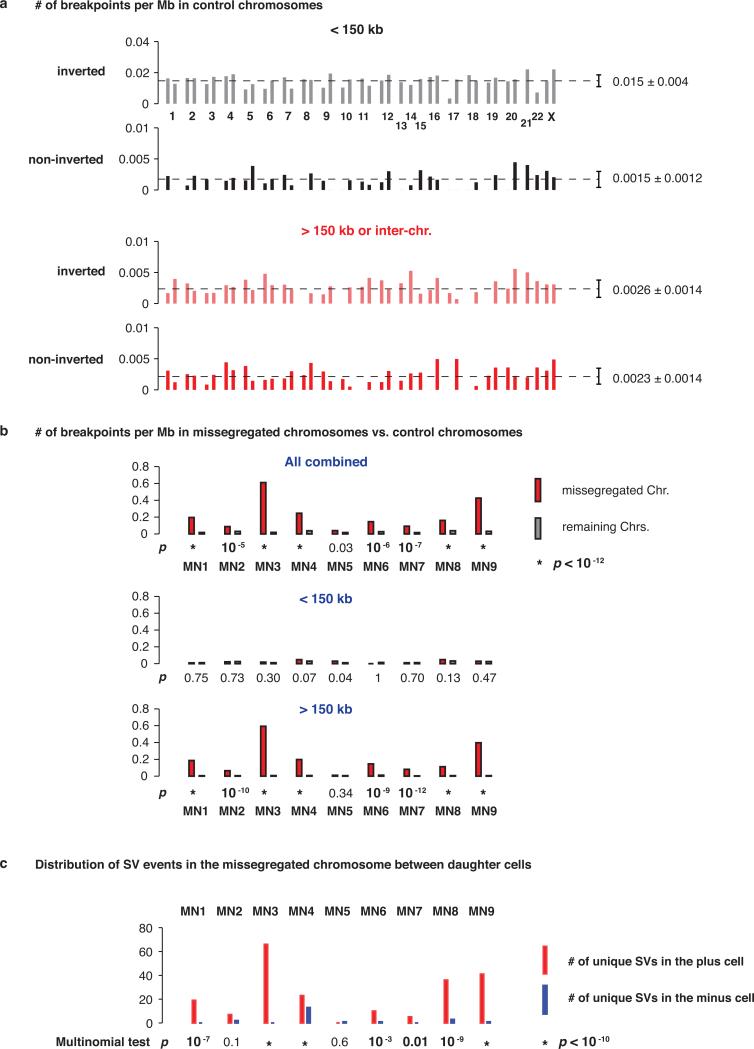
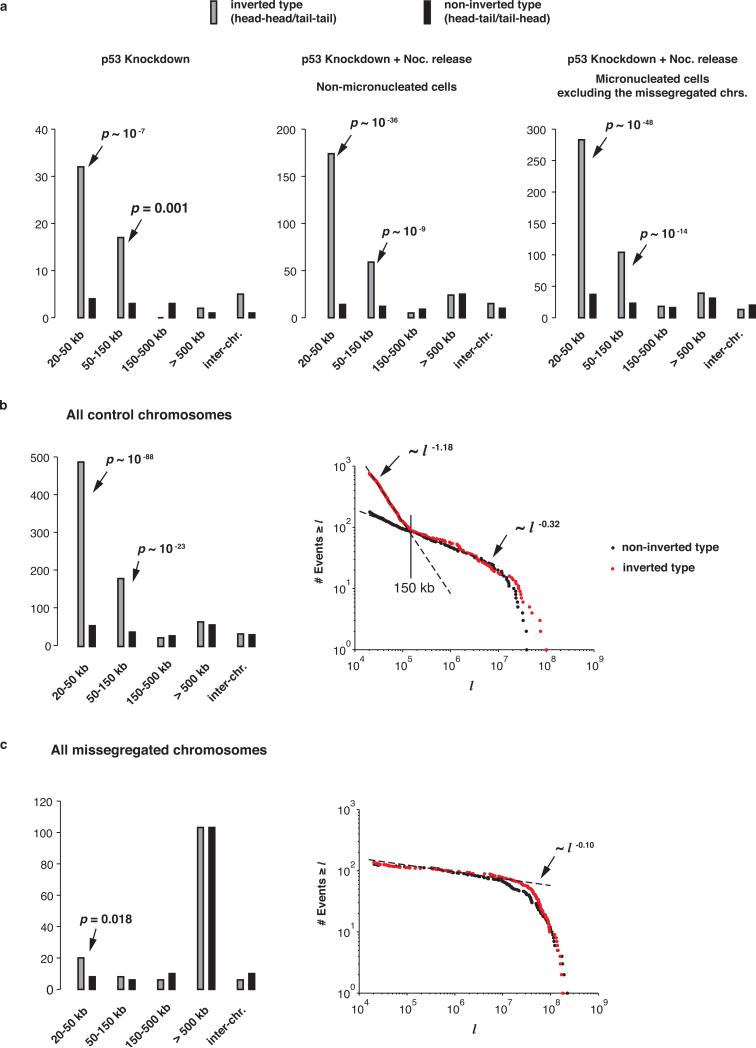
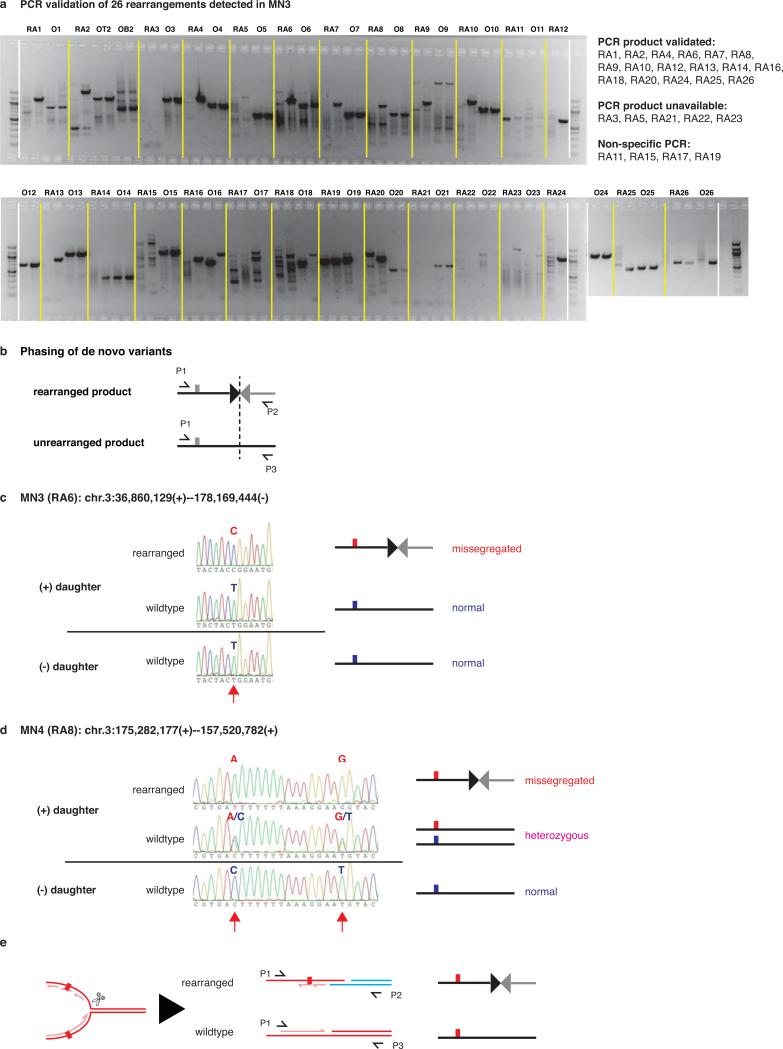
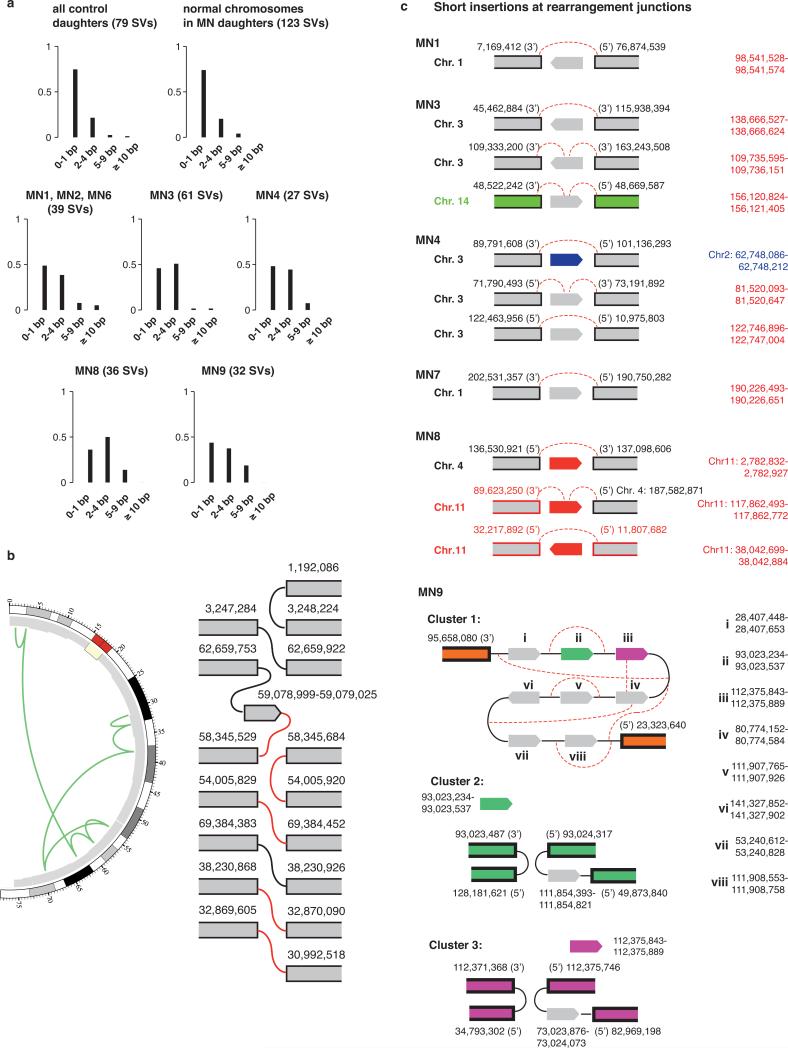
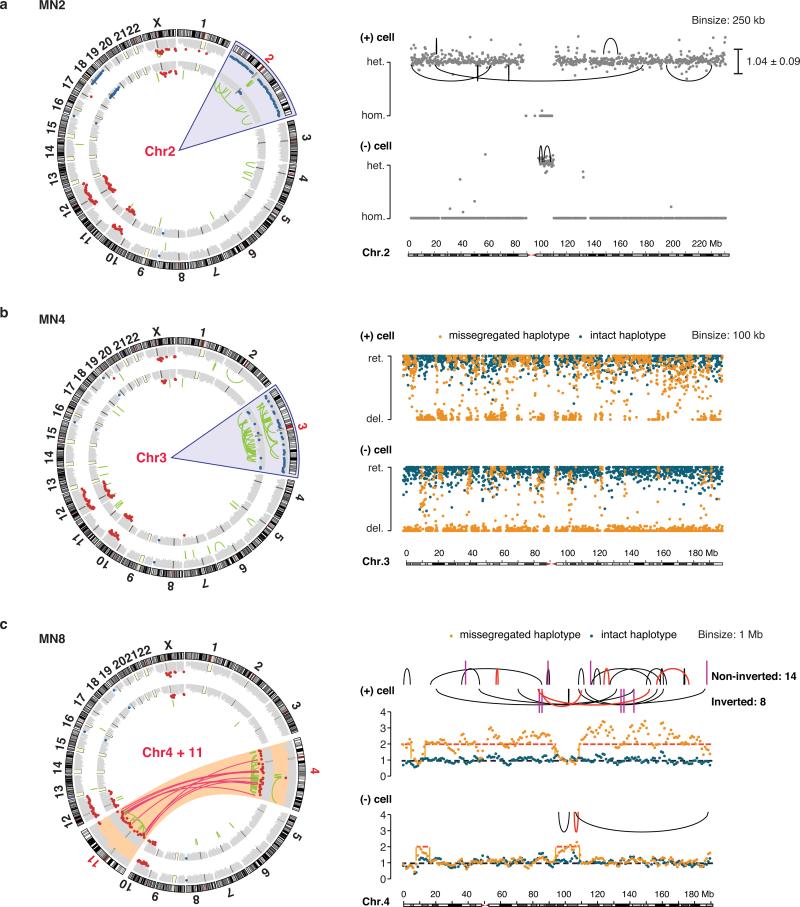
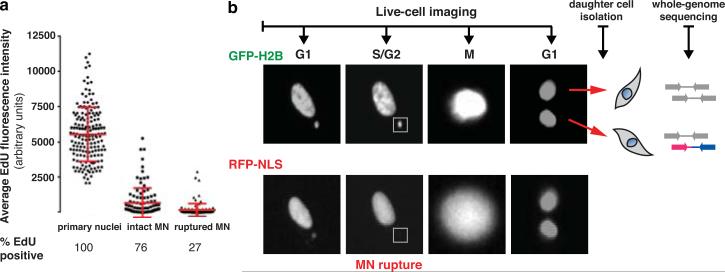
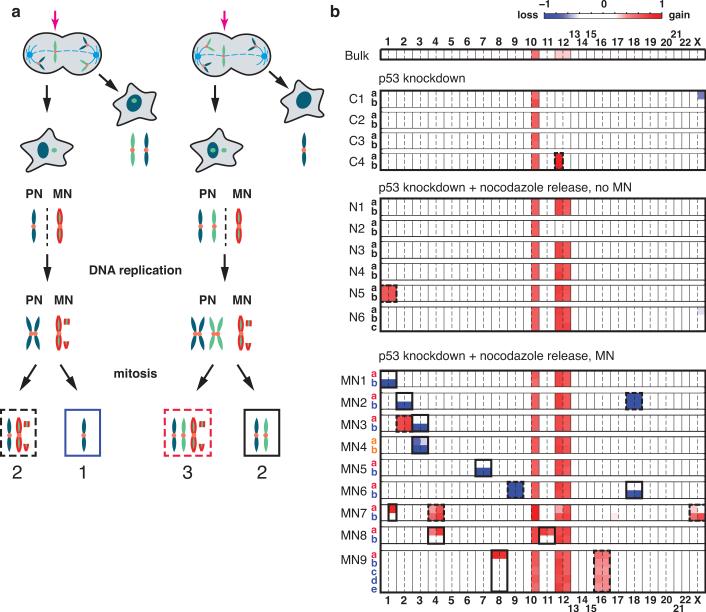
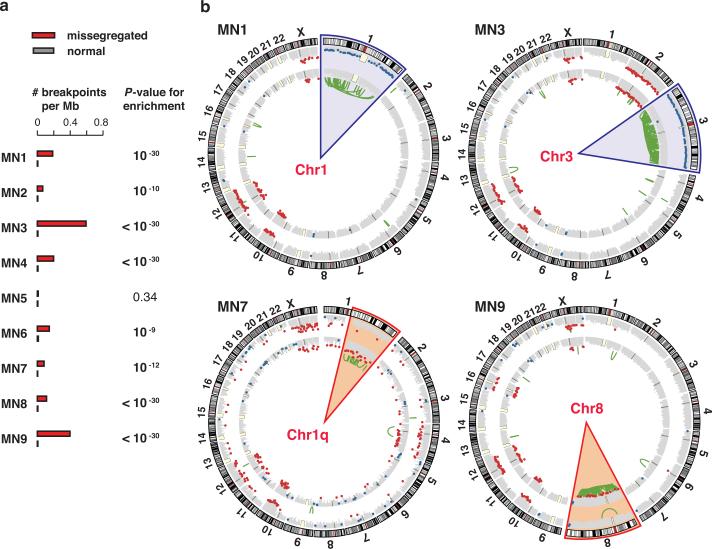
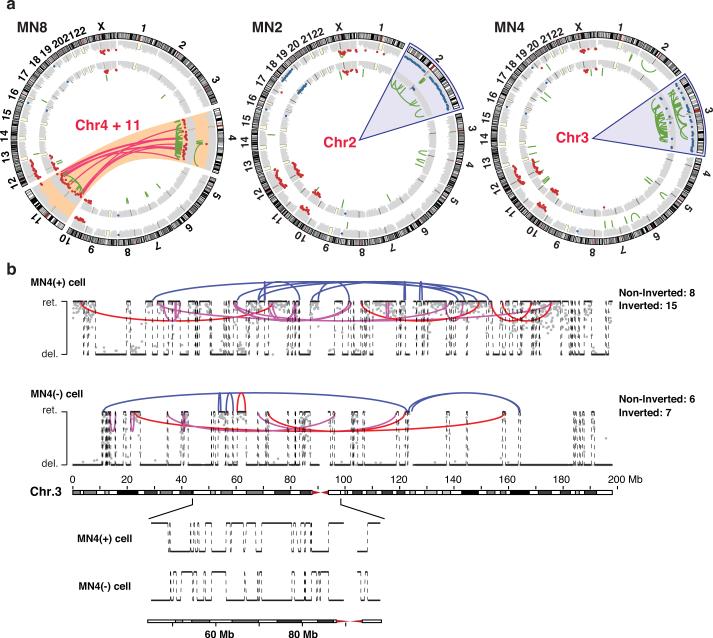
Genome sequencing has uncovered a new mutational phenomenon in cancer and congenital disorders called chromothripsis. Chromothripsis is characterized by extensive genomic rearrangements and an oscillating pattern of DNA copy number levels, all curiously restricted to one or a few chromosomes. The mechanism for chromothripsis is unknown, but we previously proposed that it could occur through the physical isolation of chromosomes in aberrant nuclear structures called micronuclei. Here, using a combination of live cell imaging and single-cell genome sequencing, we demonstrate that micronucleus formation can indeed generate a spectrum of genomic rearrangements, some of which recapitulate all known features of chromothripsis. These events are restricted to the mis-segregated chromosome and occur within one cell division. We demonstrate that the mechanism for chromothripsis can involve the fragmentation and subsequent reassembly of a single chromatid from a micronucleus. Collectively, these experiments establish a new mutational process of which chromothripsis is one extreme outcome.


Figures

Extended Data Figure 1
Extended Data Figure 1. DNA damage and double-strand breaks occur in micronuclei when replication is coincident with nuclear envelope rupture
a. Nuclear envelope rupture in G1 is not sufficient to induce DNA damage in micronuclei. Left: Graph shows the percentage of ruptured micronuclei, determined by the loss of GFP-NLS, that were positive for γ-H2AX (>3 standard deviations above the mean of S-phase primary nuclei), and the fluorescence intensities for γ-H2AX labeling in the indicated samples. N >100 from two experiments for each time point (see Methods). Error bars: standard error of the mean. Right: images of representative cells. b. Ruptured micronuclei have double-strand breaks detected by GFP-Gam. Left: Graph shows the percentage of micronuclei with one or more GFP-Gam positive foci in γ-H2AX-positive and negative micronuclei in S-phase. N > 100 from two experiments for each category (see Methods). Right: images of representative cells. Inset: magnification of GFP-Gam signal. c. Nuclear envelope rupture of micronuclei in G0 phase cells does not result in significant DNA damage. Micronucleation was induced in RPE-1 cells by a nocodazole block-and-release protocol, and cells were released into serum-depleted (G0) or serum replete medium (S) for 17 hr. Left: graph shows the percentage of micronuclei that were positive for γ-H2AX (> 3 standard deviation above the average level in S-phase primary nuclei) as well as the distribution of the fluorescence intensities for γ-H2AX labeling in the indicated samples. Percentage of ruptured micronuclei was from a parallel sample with a GFP-NLS-expressing RPE-1 line. N > 100 from two experiments for each time point (see Methods). Right: images of representative cells. Error bars show standard error of the mean. d. The majority of damaged micronuclei have initiated DNA replication. Replication was detected by continuous EdU labeling following nocodazole release and integrated EdU signal normalized over nuclear or micronuclear area. Left: percentage of γ-H2AX positive micronuclei that were positive (> 3 standard deviation above the background) or negative for EdU. N > 100 from two experiments (see Methods). Right: images of representative cells. Error bars show standard error of the mean.
Extended Data Figure 2
Extended Data Figure 2. Determination of loss-of-heterozygosity
a. Cartoon comparing the expected single-cell sequencing coverage of heterozygous and hemizygous chromosomes at polymorphic sites. Loss-of-heterozygosity (LOH) can be inferred from the scarcity of heterozygous genotypes without knowing the haplotype phase (i.e. the genotypes at polymorphic sites for each homologue). The presence or absence of the reference or the alternate base provides a digital read-out of heterozygosity or LOH that is insensitive to read-depth noise common in single-cell sequencing data. This can be quantified as a heterozygosity coefficient: the ratio of the observed fraction of heterozygosity relative to the expectation for a heterozygous chromosome consisting of a single copy of each homologue (“1:1” heterozygosity). For a diploid cell with 1:1 heterozygosity, if the fraction of sites that are covered (≥ 1 read per site) for each homologue is denoted as p, then the expected fraction of sites with heterozygous coverage is approximately p2. If the chromosomes are equally amplified then p ≈ 1/2(observed reference base + observed alternate base)/total sites (Methods). b. Heatmap of the heterozygosity coefficients for all chromosomes from all single cell samples included in Fig. 2b plus two additional single cells (“singletons”) with monosomies that were sequenced to identify the haplotype phase of the monosomic chromosomes. Near complete LOH in the MN1, MN3, MN5, and MN6 minus daughter cells independently confirmed the monosomy of the missegregated chromosome, as determined from DNA copy number analysis (Fig. 2b). Note that the MN2 and MN6 daughters had monosomies (Chr. 18 in MN2 and Chr. 9 in MN6) shared in both daughters, indicating that the monosomy was preexisting in the mother cell. Two “singletons” were identified as having monosomy in Chr. 4 and in Chr. X based on low-pass MiSeq sequencing. They were each sequenced to ~ 4.5x to generate the haplotype phase of Chr. 4 and Chr. X. Note that the second singleton also had monosomies in Chrs. 15 and 16; the haplotype phases for these two chromosomes were not used in the current study, so they were omitted from the table in c, but the data are available upon request. c. Table summarizing results from the loss-of-heterozygosity analysis. Heterozygosity coefficients are shown for the boxed chromosomes in b. Red heterozygosity coefficients indicate complete LOH; Orange are partial LOH. For the cell ID, we indicate the individual daughters as “MN#(a)” or “MN#(b)”. The cases denoted as “MN#(a/b)” are monosomies shared in both daughters. The third column lists the number of heterozygous sites detected for the indicated chromosome from the bulk sequencing data (Methods). Columns 4-6 summarize the number of sites at which sequencing coverage from each cell supports the presence of reference bases (“Ref.”), alternate bases (“Alt.”), or both (“Het.”). The last column lists the heterozygosity coefficients calculated for the indicated chromosome in the specified cell or cells. The average heterozygosity coefficient is 1.08 for all chromosomes that did not show LOH from all samples (last row). For chromosomes with near complete LOH (rows 1-8) the small number of heterozygous sites is likely due to genotyping errors (e.g., duplicated/homeologous sequences on the same chromosome) or amplification and sequencing errors. The incomplete LOH in the MN2 and MN4 daughters results from the reciprocal distribution of a fragmented chromosome between the two daughters (Extended Data Fig. 8). Note that our calculated heterozygosity coefficient can sensitively detect even a small region of heterozygosity in the MN2 minus cell (Extended Data Fig. 8a).
Extended Data Figure 3
Extended Data Figure 3. Calculation of haplotype copy number from phased haplotypes
By sequencing monosomic cells we were able to determine the haplotype phases for chromosomes 1, 3, 4, 18, and X (Extended Data Fig. 2). a. Cartoon illustrating the strategy to calculate the copy number for each haplotype (homologue) from the coverage at individual polymorphic sites. The example is shown for a cell having one copy of each homologue. The left shows the aggregate sequence data; the right shows the deconvolution of the sequence based on the determined haplotype phase. The haplotype coverage is calculated by dividing the number of sequencing reads from the indicated haplotype by the total number of heterozygous sites. Copy-number alterations affecting only one homologue can be directly identified by calculating the ratio between the two homologues. Note that this approach is robust to any recurrent amplification bias that equally affects both homologues. b. Validation of copy-number alterations in Chr. X. The haplotype phase was inferred from the sequence of a singleton cell with monosomic Chr. X. The DNA copy number analysis alone suggested frequent Chr. Xq gains shared in many daughter pairs (including all controls, Supplementary Table 2). We considered it unlikely that these inferred copy number alterations were genuine because they were not present in the bulk sample (Supplementary Table 2). We calculated the haplotype copy number to distinguish true copy-number alterations from a potential systematic amplification bias for Chr. X. Each dot represents the haplotype copy number calculated as the average coverage at all sites within each bin for which phase information could be obtained (i.e. where there was coverage in the reference cell that we sequenced with Chr. X monosomy). Haplotype copy number of Chr. X in 0.1 Mb bins in MN3 confirmed that the small yet significant gain in Xq relative to Xp affects both haplotypes equally, thus excluding the Xq gain as a genuine copy number alteration. Initial read-depth-based copy number analysis (Supplementary Table 2, Methods) also implied that there could be a copy number asymmetry for Chr. Xq for the two daughters from sample C1 as well as for Chr. X between the MN7 daughters (Fig. 2b). Calculation of the copy number of Chr. X for 0.25 Mb bins in C1 confirmed that there is no difference between the two haplotypes in Xq; thus, any variation in the combined sequence coverage likely also reflects amplification bias. By contrast, the copy number of Chr. X in MN7 (1 Mb bins) indicated that there is a true gain of a single haplotype that generates trisomy for Chr. X that is shared (preexisting) in both daughters. c. Use of haplotype copy number to validate the 3:2 segregation patterns in the MN7 and MN8 daughters inferred from DNA copy number. The haplotype phase for Chr. 1 was determined from the sequence of the MN1 minus cell. Coverage of the intact haplotype (blue dots) is evenly distributed between the daughters and throughout the chromosome; the mean coverage of this intact haplotype was used to calculate the normalized copy number of the missegregated/gained haplotype. For the MN7 daughters, there is a single copy gain of Chr. 1q in the plus daughter. By contrast, there is no gain of Chr. 1p in either cell, providing an internal control. In MN8, nearly an entire copy of Chr. 4 was gained in the plus daughter, with the exception of two segments partitioned into the minus daughter. The gains and losses both occurred only to the missegregated haplotype (orange). The reciprocal gain and loss of these segments in the two daughter cells illustrates the sensitivity of the method.
Extended Data Figure 4
Extended Data Figure 4. Statistical analysis of the enrichment of structural variants on missegregated chromosomes
a. No enrichment of structural variants was observed in control chromosomes, including all chromosomes after the division of non-micronucleated mothers plus all normally segregated chromosomes after the division of micronucleated mothers. Shown are the frequencies of short- and long-range chromosomal rearrangements, at inverted (“head-to-head/tail-to-tail”) or non-inverted (“head-to-tail/tail-to-head”) orientations, detected in all control chromosomes, plotted for each chromosome arm. The frequencies were calculated by dividing the total number of rearrangement breakpoints of each type for each chromosome by the total length of the chromosome and after correcting for copy-number alterations for each chromosome and the detection sensitivity in each sample. Fluctuation around the mean value across the genome is insignificant for all groups (p > 0.05, χ2 test for a normal distribution based on the observation). b. Enrichment of structural variants specifically on the missegregated chromosomes identified by asymmetric copy number. Top: frequency of all structural variants (breakpoints per Mb, normalized for DNA copy number and detection sensitivity) detected in the missegregated chromosomes (both plus and minus cell combined) as compared with all the remaining, normally segregated chromosomes; middle: frequency of intrachromosomal SVs with breakpoint distance < 150 kb, showing no enrichment; bottom: frequency of long-range SVs (intrachromosomal SVs with breakpoint distance > 150 kb or joining different chromosomes). P-values are derived from a one-sided Poisson test (Methods). c. Mutually exclusive distribution of SV breakpoints between the two daughters. There are three categories of events: those unique to cell “a”, those unique to cell “b”, and those shared between both cells. The frequencies in each category can be estimated given the detection sensitivity in each library, which can be inferred from the sequence coverage at heterozygous SNPs (Methods). By a multinomial test, the large number of SVs detected in the missegregated chromosome that are unique to each daughter cell cannot be explained by incomplete detection of preexisting SVs shared between the cells. This contrasts with the few shared events (one each in MN1 and in MN3; none in the others). This conclusion holds for all daughter cell pairs except those from the MN2 and MN5 mothers. For the MN2 daughters the small number of evaluable events does not reach statistical significance. The MN5 daughters are the one negative example where there does not appear to be chromosomes that underwent any significant rearrangement.
Extended Data Figure 5
Extended Data Figure 5. Length distribution of structural variants detected in single cells
a. Structural variants in control samples: Short-range rearrangements are enriched for the inverted orientation. The number of structural variants (SV) detected in three groups of controls broken down by the distance between the rearranged sequences. Left: p53 knockdown cells (C1-C4); Middle: p53 knockdown + nocodazole release (N1-N6); Right: micronucleated cells (MN1-MN9), but excluding the missegregated chromosome. Note a significant enrichment of events in the inverted orientation is observed in the 20-150 kb range in all three groups (binomial test, p < 0.05), but there was no such enrichment for SV events with breakpoint distances exceeding 150 kb or joining different chromosomes. The enrichment of short-range inverted type rearrangements can be explained by the fact that Phi-29-based multi-strand displacement (MDA) reaction used to amplify DNA generates frequent short-range inverted chimeras. b. Control chromosomes: Scaling relationship between the frequency of SVs and the distance between breakpoints. Left: combined frequency of SVs from all control chromosomes from a above. Right: The cumulative distribution of inverted (red dots) or non-inverted (black dots) SV events as a function of breakpoint distance. Note: the graph shows the accumulation from infrequent long-range rearrangements (starting on the right) to more frequent short-range rearrangements (finishing on the left). We expect that genuine rearrangements should equally favor inverted or non-inverted orientations and attribute the bias towards the inverted-type to MDA artifacts. Thus, as a filter for potential MDA artifacts, we used power-law scaling to identify the breakpoint distance above which inverted and non-inverted type rearrangements occur with approximately equal frequency. In the 20-100 kb range, the data for inverted-type rearrangements (632 events total) were best fit by a power law decay of −1.176 (+/− 0.006, 95% confidence interval) and for the non-inverted type rearrangements (85 events total) by a power law decay of −0.395 (+/− 0.005). This difference is lost in the range of 200 kb-5 Mb, where the data for inverted-type rearrangements (53 events total) were best fit by a power law decay of −0.337 (+/− 0.02) and for the non-inverted type events by a power law decay of −0.31 (+/− 0.005). The power law fitting for the inverted-type events in the 20-100 kb range and the power law fitting for events in both groups in the 200 kb-5 Mb range (−0.322 +/− 0.007) intersected at ~150 kb. This established an operational cutoff of 150 kb to define “long-range” rearrangements, above which there should be no enrichment of inverted-type MDA-generated artificial chimeras. c. Missegregated chromosomes: Scaling relationship between the frequency of SVs and the distance between breakpoints. Left: frequency of SVs from all missegregated chromosomes. By contrast with the controls in b, there is a marked enrichment of long-range SVs in this group with breakpoints > 500 kb apart. Indeed, the frequency of long-range rearrangements in these samples is substantially higher than the frequency of short-range rearrangements. The fact that these SVs are concentrated on the missegregated chromosome in the plus daughter cell (Fig. 3b, Extended Data Table 1) suggests that these are genuine rearrangements of the underreplicated chromosome from the micronucleus. Considering only the missegregated chromosome, we find a less pronounced difference in the ratio between inverted and non-inverted type rearrangements, even for short-range events. We speculate that this occurs because the missegregated chromosome also has a high frequency of genuine short-range rearrangements that are not biased to be in an inverted orientation. These numbers could also reflect a smaller sample size of rearrangements or possibly be due to rearrangement of the damaged chromosome prior to amplification, altering the relationship of the starting sequence relative to the reference genome. By establishing the 150 kb cutoff to filter for artifacts, we thus likely exclude some genuine short-range events. Finally, we note that our power law scaling analysis for SVs detected in the missegregated chromosomes is consistent with other independent estimates for the likelihood of intrachromosomal contacts. The power law dependence of ~ l −0.10 (power decay −0.105 +/− 0.003 from all events in the range of 150 kb ~ 5 Mb) is equivalent to a density distribution of p(l) ~ l −1.10. This dependence is close to the length distribution of somatic copy number alterations (~ l −1) observed in cancers, and also to the distribution of breakpoint distances for somatic chromosomal rearrangements (J. Wala and R. Beroukhim, personal communication). Moreover, it is consistent with the probability of intra-chromosomal contacts (~ l −1.03 ) inferred from Hi-C experiments.The distribution of the long-range breakpoint distances from the missegregated chromosomes shown here (150 kb ~ 10 Mb) is significantly different from the distribution of rearrangements from all control chromosomes, shown above in b (p = 0.0043, Kolmogorov-Smirnov test). By contrast, pairwise comparisons of the distribution of the control samples (a, above) showed no significant differences (p = 0.6 for all events, p = 0.9 for long range events, K-S test).
Extended Data Figure 6
Extended Data Figure 6. Validation of rearrangements by PCR and haplotype phasing
a. PCR validation of 26 (out of 66) intra-chromosomal rearrangements detected in Chr. 3 of the MN3 plus daughter. The complete results for all samples are summarized in Supplementary Table 5 with examples of the Sanger sequencing results shown below (c,d). For each rearrangement, two PCR reactions (“RA” across the putative rearrangement junction, “O” for the reference sequence) were performed on the MDA amplified DNA from both daughter cells. For each sample indicated above the gel, the leftmost lane is the PCR product for the rearrangement-specific primers in the minus daughter; the left middle lane the rearrangement-specific primers in the plus daughter; the right middle lane, the reference-specific primers in the minus daughter; and the right lane, the reference-specific primers in the plus daughter. In “RA2” where there are heterozygous SNPs on both ends of the rearrangement junction, PCR was performed to generate (and have validated) the genotypes at both sites.17 out of 26 PCR products confirmed the rearrangement junction after Sanger sequencing. The remaining 9 PCR reactions generated no product or products that did not correspond to the rearrangement sequence; several of these were due to low sequence complexity near the rearrangement junction that resulted in non-specific primer pairs. b. Cartoon showing the strategy for validating rearrangements and associating these rearrangements with the missegregated haplotype. Forward PCR primers were chosen 5’ from an informative heterozygous site and reverse primers were chosen 3’ of the rearrangement breakpoint junction, either in the rearranged DNA sequence or in the reference DNA sequence. PCR was performed to amplify both the rearranged product and the control reference genome product, followed by Sanger sequencing. Here the undetermined base at the polymorphic site is colored grey. c. Example of haplotype validation for a rearrangement in MN3 based on an adjacent “C/T” SNP. From the minus daughter, we were only able to amplify the reference product, which showed a “T” at the polymorphic site. Because MN3 underwent a 2:1 segregation, the missegregated haplotype was inferred to have a “C” at this polymorphic site. From the plus daughter, we amplified both the rearranged and reference products. As expected, the rearranged showed a “C” at the polymorphic site, indicating that the rearrangement occurred on the missegregated chromosome. Also as expected, there was a “T” at the polymorphic site on the reference product. The base associated with the missegregated haplotype is in red; the base for the normal haplotype is in blue. d. Example of haplotype validation for a rearrangement in MN4 yielding three products. In this case, there are two informative polymorphic sites near the rearrangement: the “A+G” pair is associated with the missegregated haplotype and the “C+T” pair is associated with the intact reference haplotype. As expected, the minus daughter had the reference product showing the “C+T” haplotype. Also as expected, the plus daughter had the rearranged product showing the “A+G” haplotype as well as the reference product showing the “C+T” haplotype. Somewhat unexpectedly, the plus daughter also had a third product: a reference product associated with the “A+G” missegregated haplotype. We speculate that the presence of both rearranged and reference products with the missegregated haplotype results from partial replication of this region of the missegregated chromosome. e. Proposed partial replication/replication fork breakage model to explain the presence of three products detected in d above. Shown on the left is a replication fork on the missegregated chromosome, in the middle are the products of replication or recombination, and on the right are the products with the red bar indicating that the products are associated with the missegregated haplotype. The original DNA strands are in dark red; the newly synthesized ones are in light red; DNA from a distal rearrangement partner locus is in blue. We hypothesize that breakage of the replication fork (scissors) generates a single-end break that recombines with the distal locus shown in blue. The other end of the replication fork generates a reference product. Importantly, both products should contain the base(s) associated with the missegregated haplotype. The presence of both rearranged and reference products containing the missegregated haplotype could also occur if the rearrangement is an artificial chimera that arose during MDA amplification. However, such artifacts should not be restricted to a single homologous chromosome: the highly significant enrichment of rearrangements on the missegregated chromosome and their association with the missegregated/gained haplotype establish that most of these rearrangements are genuine. Notes: 1. Rearrangements were not only associated with the missegregated haplotype by PCR, but in some cases this association could be made directly by sequencing read-based phasing utilizing either discordant read pairs or split reads that covered heterozygous SNP sites close to either side of the breakpoint. This analysis enabled us to determine the haplotype association for 10 events in MN3 (3 in addition to Sanger sequencing), 5 events in MN4 (3 in addition to Sanger sequencing), and 6 events in MN8 (5 in addition to Sanger sequencing), all confirmed to be associated with the gained haplotype. 2. For the daughters with a 3:2 segregation pattern, even if the plus cell contained an intact copy of the missegregated chromosome, we expect a replicate of this homologue to be present in the minus cell because that copy of the homologue was normally segregated. Because we did not detect any rearrangements in the minus cell, the rearrangements detected in the plus daughter can only come from the missegregated copy of the homologue in that daughter.
Extended Data Figure 7
Extended Data Figure 7. Sequence features at the rearrangement junctions
a. Length distribution of microhomology at the junctions of rearrangements in control chromosomes (top), in the missegregated chromosomes of daughters with 2:1 segregations (middle), and in the missegregated chromosomes from daughters with 3:2 segregations (bottom). The distribution of microhomology at rearrangement junctions detected in all control daughters is indistinguishable to that detected in the control chromosomes in the micronucleated daughters, with ~ 75% of events showing 0-1 bp homology. By contrast, rearrangements in the missegregated chromosomes contain a higher percentage of microhomology: more than 50% of all events exhibited > 1bp homology in every sample. b. Chained translocations between breakpoints on Chr. 18 in the MN6 plus daughter. Left: CIRCOS plot for the translocation chain in Chr.18; Right: translocation links between 16 breakpoints, 14 of which had paired break ends forming a chain. All events were validated by PCR, and red links reflect rearrangements that were associated to the gained haplotype through nearby SNPs (Supplementary Table 5). c. Examples of short (50-500 bp) insertions at breakpoint junctions. Dashed red links represent read pairs supporting the given junction. In addition to insertions derived from the missegregated chromosome and inserted into rearrangements in the missegregated chromosome, we identified additional examples as follows: For the MN3 sample we identified one example of Chr. 3 insertion into a rearrangement between two loci in (normally segregated) Chr. 14. For the MN4 sample we also identified one example where a short segment from (normally segregated) Chr. 2 was inserted into a rearrangement between loci in the missegregated Chr. 3. For the MN8 sample, where both Chr. 4 and Chr. 11 were inferred to have been fragmented in the same micronucleus, we identified one example where a rearrangement between loci on Chr. 4 contained a 95 bp insertion from Chr. 11 in the rearrangement junction and another example of a 279 bp segment originated from Chr. 11 inserted into a Chr. 4-Chr. 11 rearrangement junction. In MN9, we have identified >20 insertions at sites of long-range rearrangements on Chr. 8 via local sequence assembly (Supplementary Table 6). Here we show one translocation junction containing 8 short segments from all over Chr. 8. The segments at the boundaries of the rearrangement are in bold outline. Between the boundaries are 8 short insertions (47-433 bps, grey, green or purple bars) from different parts of Chr. 8 (cluster 1). Green and purple bars indicate insertions originating at or near breakpoints of other rearrangements (clusters 2 and 3, correspondingly green or purple). As the average detection sensitivity was ~ 35% for each library (Supplementary Table 1), it is likely that some insertions could have been missed. Importantly, the insertions only come from distal sites on the missegregated chromosome(s) and such insertions are not detected in any control samples. Note: 1. We can only determine the presence of insertion sequences < 500 bp as most sequencing fragments are shorter than 600 bp (99% of fragments are shorter than 600 bp in the DNA library of the MN9 plus daughter, < 513 bp for the MN1 plus daughter, < 380 bp for the MN3 plus daughter, MN4 daughters, MN8 plus daughter, and < 350 bp for the MN7 plus daughter). 2. The MN9 sample has many more insertions than the other samples with the inserted segments frequently derived from sequences near other rearrangement breakpoints. The explanation for this is not clear and future work will require experiments of a larger sample size. However, unlike the MN1-MN8 daughters, which were isolated shortly after division of the micronucleated mother, the MN9 plus cell remained arrested for a ~ 2 day period of time while the minus daughter divided twice. We speculate that the missegregetaed chromosome in the plus daughter from the MN9 daughter pair have undergone MMBIR as part of the mechanism that combined these Chr. 8 fragments. It is also possible that breakpoint ends in the MN9 plus cell could have been fragmented into small segments.
Extended Data Figure 8
Extended Data Figure 8. Evidence of chromosomal fragmentation detected from haplotype copy-number analyses in three examples, MN2, MN4, and MN8
a. Inference of chromothripsis of Chr. 2 in the MN2 daughters without knowledge of the Chr. 2 haplotype phase. Left: CIRCOS plot. Right: Plot of the heterozygosity coefficients in 250 kb bins, with rearrangement links indicated (above: non-inverted type; below: inverted type). Note that the MN2 daughters underwent a 2:1 distribution of the missegregated chromosome, implying that any chromosomal loss generates loss-of-heterozygosity. The heterozygosity plot demonstrates that a pericentric fragment of 2q is partitioned into the minus cell, whereas the remainder of Chr. 2 is in the plus daughter. Chromosomal rearrangements are only observed in heterozygous regions, consistent with heterozygosity originating from the damaged/underreplicated homologue from the micronucleus. Each dot represents the heterozygosity coefficient in a 250 kb bin (~ 50 heterozygous sites per bin). Bins with fewer than 25 phaseable heterozygous sites or showing only 1~2 observed heterozygous sites are not shown. b. Haplotype copy number of Chr. 3 in the MN4 daughters (100 kb resolution). Left: CIRCOS plot. Right: Chr.3 haplotype copy number in MN4 daughters calculated from the chromosomal haplotype phase derived from the sequence of the MN3 minus daughter. Each dot represents average haplotype copy number in a 100 kb bin: the normally segregated haplotype (blue dots) is equivalently detected in both daughters whereas the fragmented haplotype (orange dots) shows oscillating and reciprocal retention and loss between the two daughters. c. Haplotype copy number of Chr.4 in the MN8 daughters with rearrangement links. The haplotype phase for Chr. 4 was inferred from the sequence of a single cell with Chr. 4 monosomy (Extended Data Fig. 2c). Gains of the missegregated haplotype (orange dots) are reciprocal in both daughters; except for one rearrangement in the plus daughter, all detected breakpoints, including both intrachromosomal events (links) and interchromosomal events with Chr. 11 (vertical magenta lines), are restricted to regions of gains in the missegregated haplotype. Red links indicate translocations that are associated with the missegregated haplotype by informative SNPs near the breakpoints; black links indicate rearrangements for which phasing validation was not performed (a subset of which have no adjacent SNPs).
Figure 1
Figure 1. Look-Seq procedure to analyze DNA damage from the underreplicated chromosomes in micronuclei
a. Reduced DNA replication in both intact and ruptured micronuclei. Left: Fluorescence intensity measurements after continuous EdU labeling following release from a nocodazole block. EdU intensity is normalized to nuclear area (N >100 from two experiments for each category, see Methods). Red bars: mean and standard deviation. b. Look-Seq strategy. Disruption of the micronuclear envelope is visualized by the loss of a nuclear localized fluorescent protein (RFP-NLS); reincorporation of the micronucleus is inferred from the absence of micronuclei in either G1 daughter.
Figure 2
Figure 2. Identification of the missegregated chromosome by DNA copy number analysis
a. Predicted DNA copy number outcomes for daughter cells derived from a micronucleated mother cell. Left: Lagging chromosome (magenta arrow) is correctly segregated, but partitioned into a micronucleus (MN); Right: lagging chromosome is missegregated into a micronucleus. The chromosome in the micronucleus is underreplicated and asymmetrically segregated, resulting in either a 2:1 (left) or 3:2 (right) copy number ratio in daughter cells. Homologue in the micronucleus: light green; homologue in the primary nucleus (PN): blue; red outline indicates the underreplicated chromosome from the micronucleus. Hatched box: “plus” daughter; solid box: “minus” daughter. b. Heatmap of arm-level DNA copy number (log2 ratio) in daughter cells derived from micronucleated mothers (MN1-MN9) or non-micronucleated controls (C1-C4, N1-N6, see Supplementary Table 2). Mother cells are listed on the left with daughters, “a” and “b”. Chromosomes are shown on the x-axis; dotted lines separate p and q arms. Preexisting aneuploidies in mother cell: dashed boxes; de novo missegregations with copy number asymmetry: solid boxes. Top panel: bulk RPE-1 line; top middle panel: daughters from non-micronucleated mothers; middle panel: non-micronucleated controls after nocodazole release; bottom panel: daughter cells from micronucleated mothers. For N6, one daughter cell divided once, producing three cells. For MN9, extra time was provided for additional cell divisions: The plus daughter did not divide whereas the minus daughter divided twice, generating five cells in total.
Figure 3
Figure 3. Enrichment of long-range rearrangements on the missegregated chromosome in the predicted daughter cell
a. Left: frequency of long-range rearrangements detected in the missegregated chromosomes (both plus and minus cell, red bars) as compared with the remaining chromosomes (grey bars): # breakpoints per Mb is normalized for DNA copy number and the detection sensitivity. Right: P-values for enrichment derived from a one-sided Poisson test (Methods). b. CIRCOS plots showing DNA copy number (grey histograms) and long-range intra-chromosomal rearrangements (green links) for four daughter pairs from micronucleated mothers. Outside ring: chromosome banding pattern. Grey histograms: DNA copy number (5 Mb bins) for the minus cell (outer ring) and the plus cell (inner). (For MN9, one “grandchild” of the minus daughter is shown, cf. Fig. 2). Red dots: bins with significant gains (>1.35x mean); blue dots: bins with significant loss (<0.6x mean). Loss of 19p and gain of Xq are seen in all single cell samples but not in the bulk and are attributed to systematic amplification bias (Extended Data Fig. 3b). Light blue cones: chromosomes with 2:1 missegregations; orange cones: 3:2 missegregations.
Figure 4
Figure 4. Two-state oscillating copy-number patterns characteristic of chromothripsis
a. CIRCOS plots for three daughter cell pairs where both daughters received fragments of the missegregated chromatid. The MN8 minus daughter contains two Chr. 4 fragments missing from the plus daughter; the MN2 minus daughter contains one segment of Chr. 2q missing from the plus daughter; for the MN4 pair, dozens of Chr. 3 fragments are reciprocally distributed between the daughters. b. Reciprocal distribution of fragments of the missegregated chromatid results in two-state copy number oscillations (retention or loss) of the missegregated haplotype in both daughters. Grey dots: average copy number of the missegregated haplotype (100 kb bins). The other haplotype is intact in both daughters (shown in Extended Data Fig. 8b). Blue links indicate non-inverted type rearrangements; magenta links indicate inverted type rearrangements. Red links indicate rearrangements directly associated with the missegregated haplotype by nearby SNPs (Supplementary Table 5). Reciprocal distribution of Chr. 3 fragments is evident from the complementarity of DNA copy-number in both daughters shown for the 50-100 Mb region (inset, bottom).
Figure 5
Figure 5. Circular chromosomal structures resulting from chromothripsis
Shown are four circular structures formed by single segments (a and b) or by multiple separate segments (c and d); a and c are from the MN4 plus daughter; b and d are from the MN4 minus daughter. In each panel, circularized fragments are shown with the reference coordinates on the left, with 5’ breaks (black triangles) and 3’ breaks (red triangles) linked by rearrangements indicated by dashed lines; resulting circular structures are illustrated on the right (not to scale).

Comment in

Similar articles

Cited by

References

    1. Yates LR, Campbell PJ. Evolution of the cancer genome. Nature reviews. Genetics. 2012;13:795–806. doi:10.1038/nrg3317. - PMC - PubMed
    1. Helleday T, Eshtad S, Nik-Zainal S. Mechanisms underlying mutational signatures in human cancers. Nature reviews. Genetics. 2014;15:585–598. doi:10.1038/nrg3729. - PMC - PubMed
    1. Zhang CZ, Leibowitz ML, Pellman D. Chromothripsis and beyond: rapid genome evolution from complex chromosomal rearrangements. Genes & development. 2013;27:2513–2530. doi:10.1101/gad.229559.113. - PMC - PubMed
    1. Stephens PJ, et al. Massive genomic rearrangement acquired in a single catastrophic event during cancer development. Cell. 2011;144:27–40. doi:10.1016/j.cell.2010.11.055. - PMC - PubMed
    1. Rausch T, et al. Genome sequencing of pediatric medulloblastoma links catastrophic DNA rearrangements with TP53 mutations. Cell. 2012;148:59–71. doi:10.1016/j.cell.2011.12.013. - PMC - PubMed

Publication types

Associated data