. 2015 Jul 10;290(28):17415-38.
doi: 10.1074/jbc.M115.643577. Epub 2015 May 27.

Prion-Protein-interacting Amyloid-β Oligomers of High Molecular Weight Are Tightly Correlated with Memory Impairment in Multiple Alzheimer Mouse Models

Affiliations

Prion-Protein-interacting Amyloid-β Oligomers of High Molecular Weight Are Tightly Correlated with Memory Impairment in Multiple Alzheimer Mouse Models

Mikhail A Kostylev et al. J Biol Chem. .

Abstract

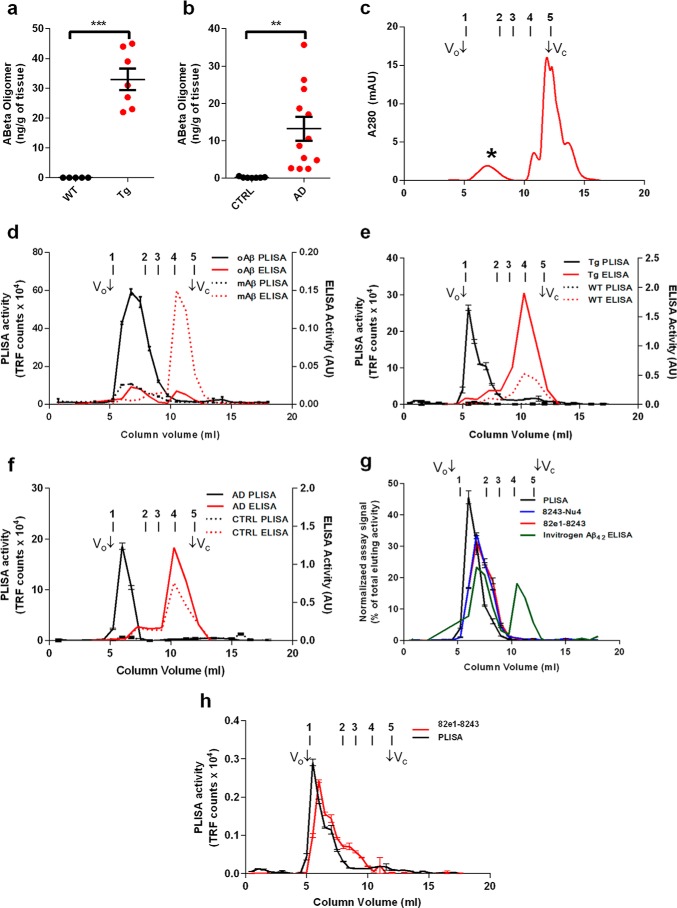
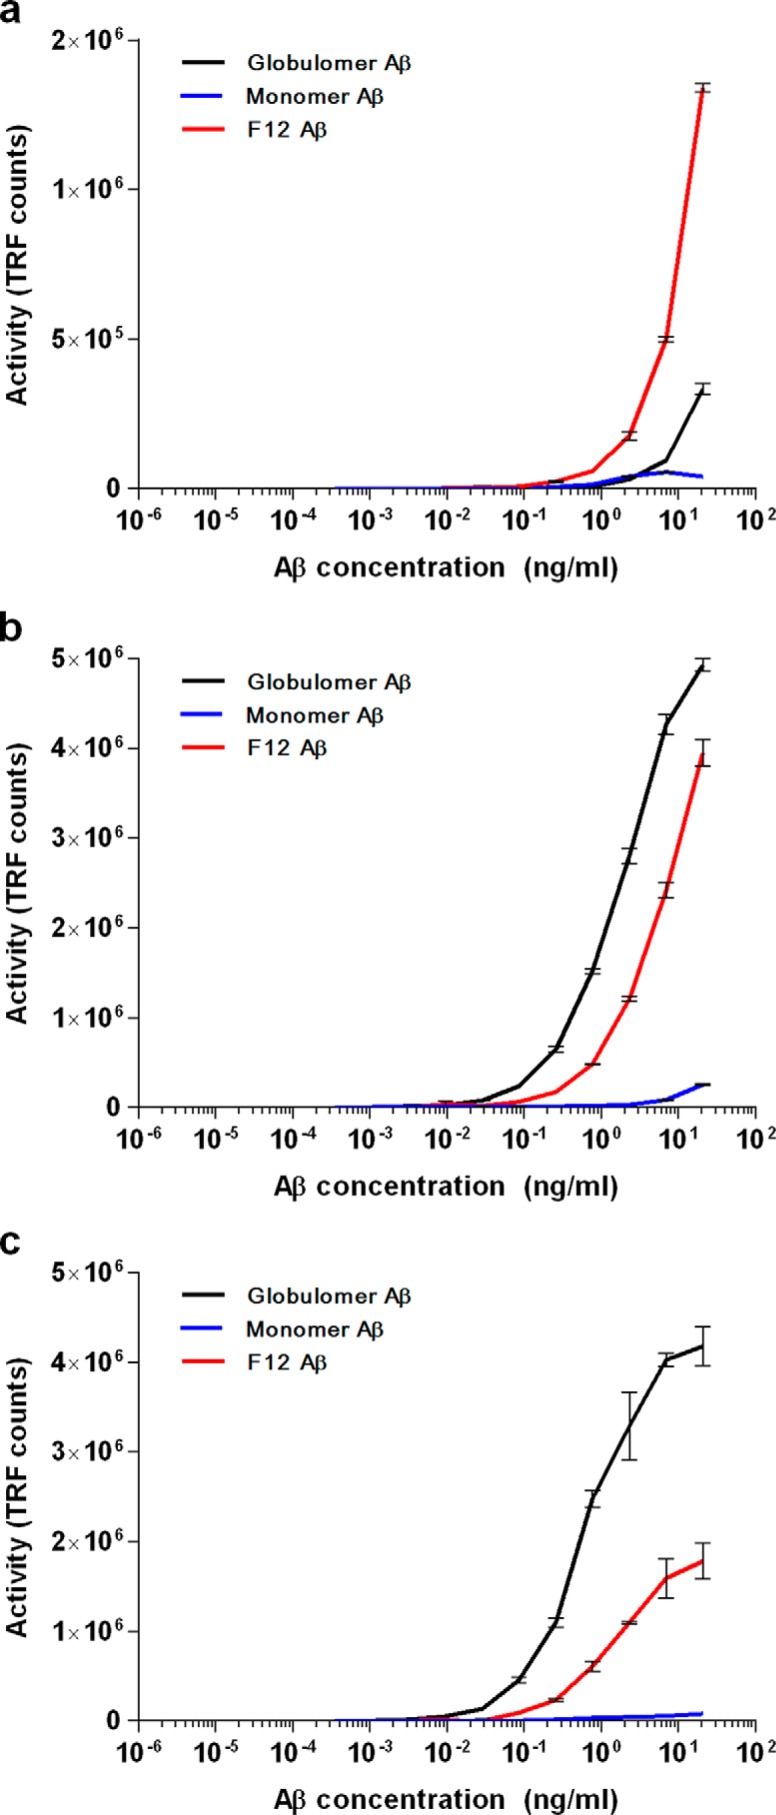
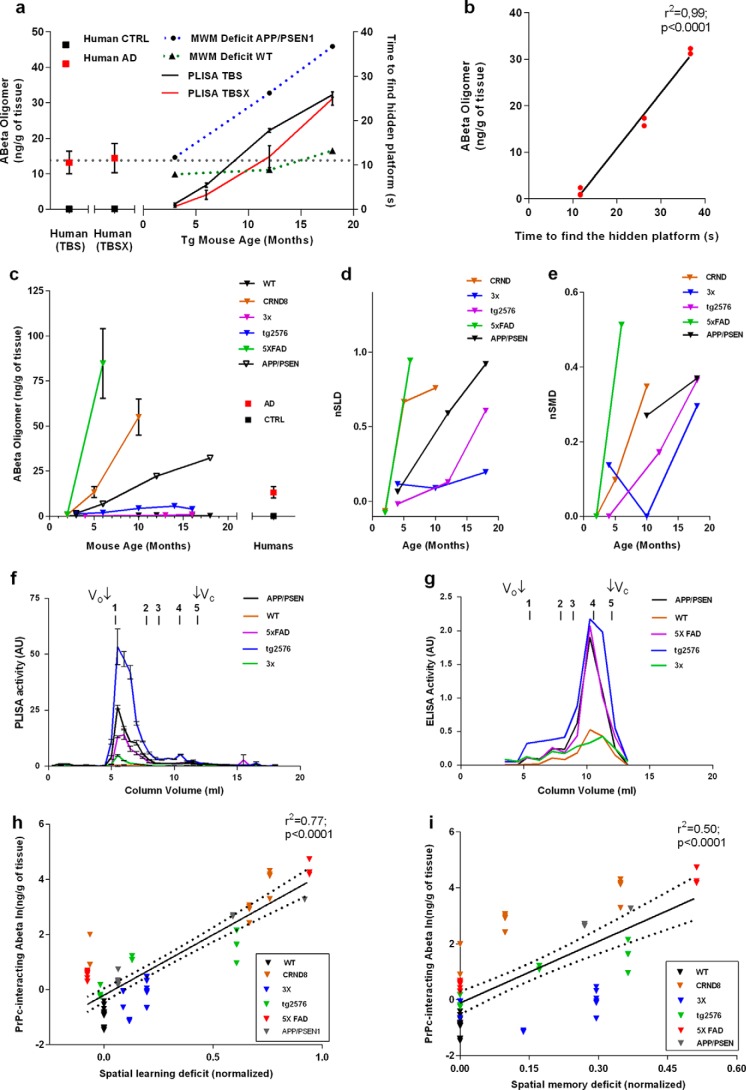
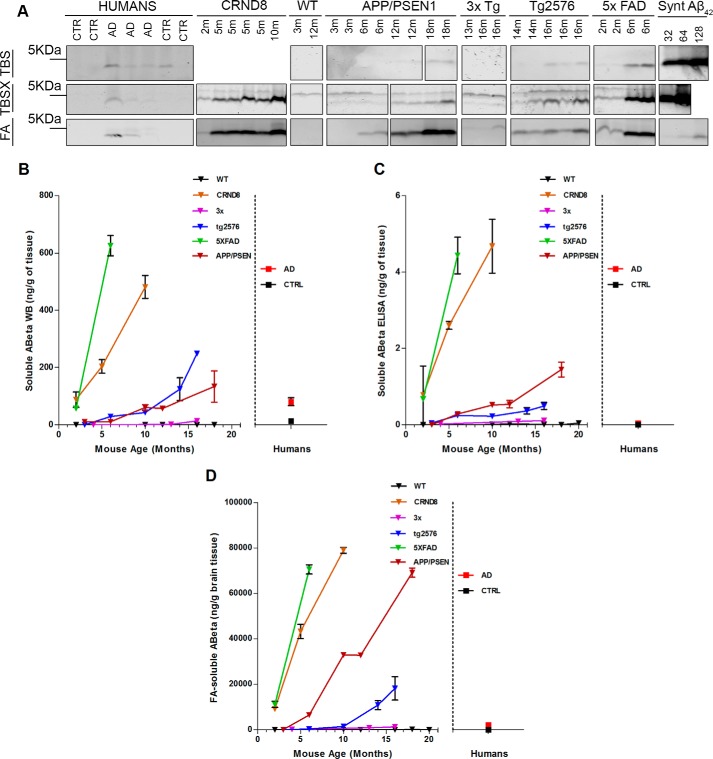
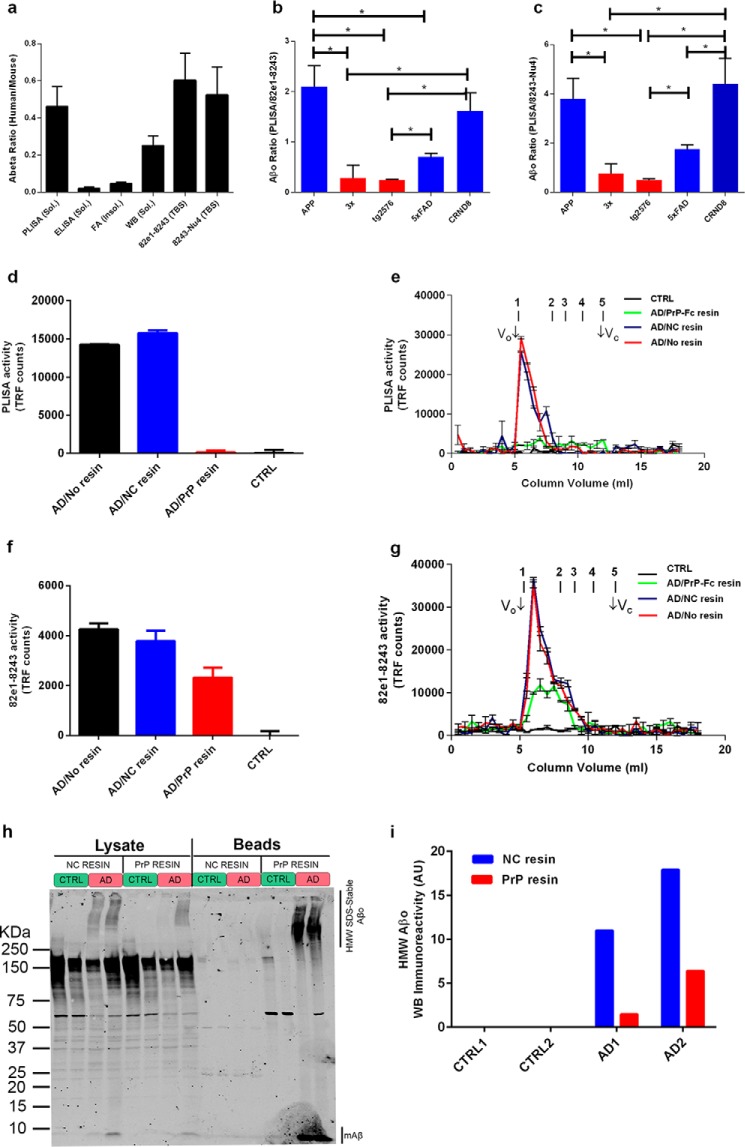
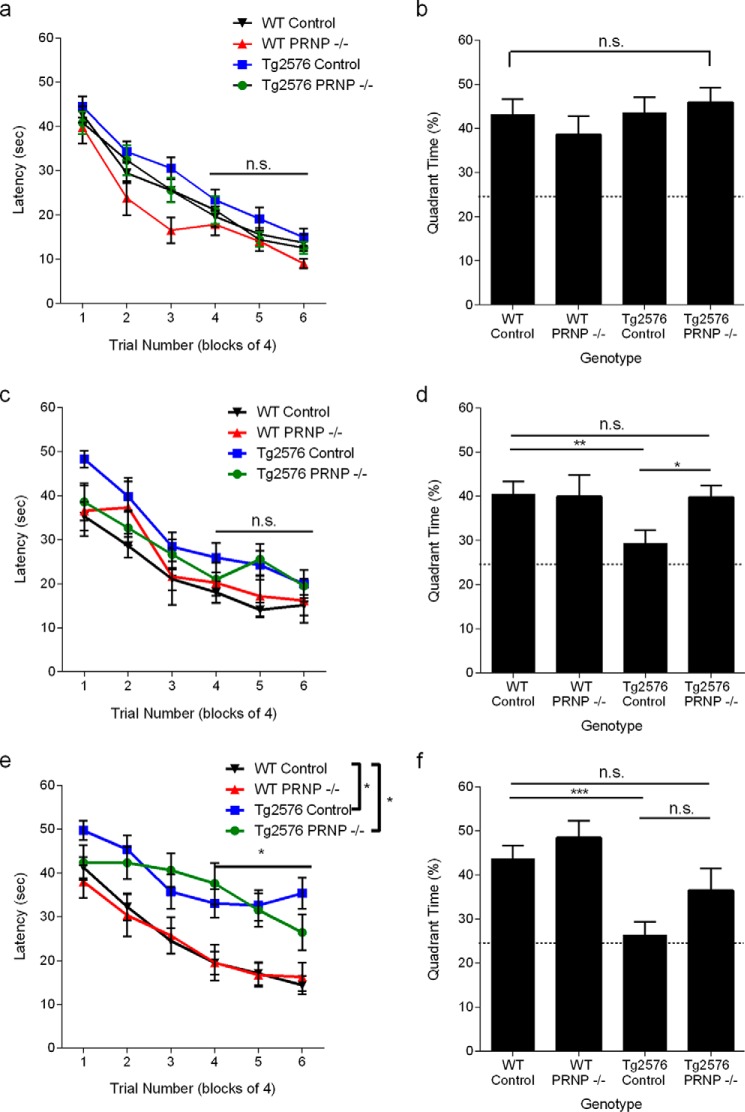
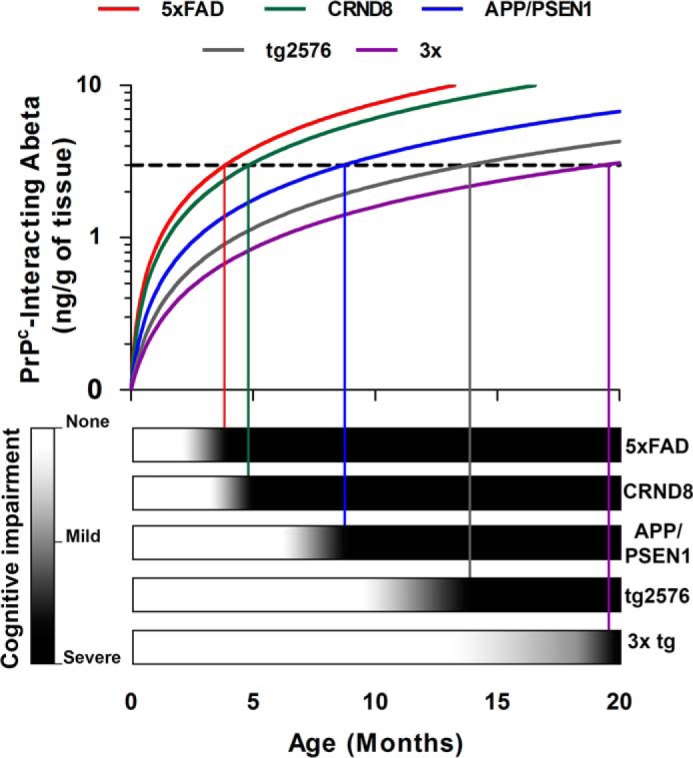
Alzheimer disease (AD) is characterized by amyloid-β accumulation, with soluble oligomers (Aβo) being the most synaptotoxic. However, the multivalent and unstable nature of Aβo limits molecular characterization and hinders research reproducibility. Here, we characterized multiple Aβo forms throughout the life span of various AD mice and in post-mortem human brain. Aβo exists in several populations, where prion protein (PrP(C))-interacting Aβo is a high molecular weight Aβ assembly present in multiple mice and humans with AD. Levels of PrP(C)-interacting Aβo match closely with mouse memory and are equal or superior to other Aβ measures in predicting behavioral impairment. However, Aβo metrics vary considerably between mouse strains. Deleting PrP(C) expression in mice with relatively low PrP(C)-interacting Aβo (Tg2576) results in partial rescue of cognitive performance as opposed to complete recovery in animals with a high percentage of PrP(C)-interacting Aβo (APP/PSEN1). These findings highlight the relative contributions and interplay of Aβo forms in AD.

Keywords: Alzheimer disease; amyloid-beta (AB); learn; ligand-binding protein; memory; oligomer; prion; transgenic mice.


Figures

FIGURE 1.
FIGURE 1.
Characterization of PrPC-interacting Aβo. Using PLISA, amounts of PrPC-interacting Aβ oligomers were quantified in brain lysates from wild-type (black dots) and APP/PSEN1 (red dots) transgenic mice (a) as well as from neurologically healthy (black dots) and AD-affected (red dots) human individuals (b). Human AD patient and APP/PSEN mouse samples showed considerably higher levels of Aβo compared with WT mice and human control samples, which had only marginally detectable levels of Aβo. Synthetic Aβ was oligomerized in F-12 medium and separated using size-exclusion chromatography (c). Aβo peak elutes in early fractions (*), whereas monomeric Aβ elutes at the very end of separation (monomeric Aβ peak corresponds to highly absorbing components of F-12 medium, large peak at Vc). SEC fractionation was performed on oligomeric (oAβ, straight lines) and monomeric preparations (mAβ, dashed lines) of synthetic Aβ (d), and fractions were assayed using PLISA (black lines) and conventional ELISAs (red lines). PLISA demonstrated strong preference toward high molecular weight Aβ assemblies showing strong peak in column void volume (Vo) and early fractions, particularly prominent in oligomeric preparation. ELISA was mostly specific toward monomeric forms of Aβ resulting in sharp peak close to fractions corresponding to total column volume (Vc). In analogy with synthetic Aβ preparations, SEC fractionation coupled to PLISA and ELISA was performed on TBS brain lysates of APP/PSEN1 (Tg, straight lines) and wild-type control (WT, dashed lines) mice (e) as well as TBS lysates from post-mortem brain tissue from human AD patients (AD, straight lines) and neurologically healthy control individuals (CTRL, dashed lines) (f). Similarly to synthetic material, PLISA was highly selective toward HMW Aβ assemblies only in AD-related but not in control samples, whereas ELISA was mostly detecting monomeric Aβ. PLISA activity forms a sharp peak in HMW fractions, whereas the activity of Aβ oligomer-specific ELISAs (8243-Nu4, 82e1-8243) distributes proportionally to the amount of eluting Aβo (g). Specificity of PLISA toward HMW Aβo was also true for TBS brain lysates from old APP/PSEN1 mice, whereas 82e1-8243 detected a broader range of Aβo species (h). Bio-Rad Gel Filtration protein standards were used to aid with the molecular weight determination of Aβ species: peak 1, thyroglobulin (bovine), 670 kDa; peak 2, γ-globulin (bovine), 158 kDa; peak 3, ovalbumin (chicken), 44 kDa; peak 4, myoglobin (horse), 17 kDa; peak 5, vitamin B12, 1.35 kDa. mAU, milliabsorbance units. Error bars represent S.E.
FIGURE 2.
FIGURE 2.
Relative detection of Aβ oligomer in different assays. Dose-dependent binding of monomeric, F-12 (oligomeric), and globulomer (oligomeric) preparations of synthetic Aβ(1–42) in PLISA (a), 82e1-8243 (b), and 8243-Nu4 (c) assays. Error bars represent S.E. of assay technical replicates. TRF, time-resolved fluorescence.
FIGURE 3.
FIGURE 3.
Levels of PrPC-interacting Aβo rise with age and are tightly linked to development of learning deficit in multiple mouse models of AD. a, levels of PrPC-interacting Aβo were measured using PLISA in TBS (black line) and TBSX (red line) brain protein extracts from APP/PSEN mice at 3, 6, 12, and 18 months of age, as well as from human AD-affected (red squares) and control (black squares) individuals. Learning deficits were also assessed in APP/PSEN mice using the Morris water maze hidden platform navigation task at 3, 12, and 18 months (APP/PSEN, dashed blue line; WT, dashed green line). PLISA activity levels increased with the age of APP/PSEN mice and were highly coherent with the progressive decline in spatial learning. Regression analysis using linear growth curve fit further demonstrated the link between PLISA levels and learning deficit (b). Error bars represent S.E. c, levels of PrPC-interacting Aβ oligomers were measured across multiple ages of WT (2, 3, 10, 12, 16, and 18 months), CRND8 (2, 5, and 10 months), 3× Tg (4, 13, and 16 months), Tg2576 (3, 6, 10, 14, and 16 months), 5× FAD (2 and 6 months), and APP/PSEN1 (3, 6, 12, and 18 months) as well as human AD and control individuals (please see Tables 1 and 2 for details on sample sizes for each group). All AD model mice but not WT animals demonstrated an increase in PrPc-interacting Aβ oligomers; however, the rates of accumulation varied greatly between models. To assess interstrain comparison of cognitive decline, behavioral data from in-house experiments (Tg2576, APP/PSEN1, 3× Tg) as well as literature data (5× FAD, CRND8 (65, 69, 70)) were converted into a normalized performance in Morris water maze hidden platform navigation task (normalized spatial learning deficit, nSLD) (d) and Morris water maze probe trials (nSMD) (e). SEC characterization of brain lysates from WT, 5× FAD, Tg2576, and 3× Tg mice coupled to PLISA (f) and Aβ42 ELISA (g) have demonstrated results consistent with ones observed for APP/PSEN1 mice in Fig. 1; PrPC-interacting Aβo specifically detected by PLISA were represented by HMW Aβ assemblies highly conserved across all tested mouse strains, whereas Aβ42 ELISA was largely specific toward monomeric Aβ. Regression analysis using exponential growth curve fit demonstrated that PrPc-interacting Aβ oligomers possess an excellent ability to predict the decline of cognitive performance in mice, both in form of spatial learning (h) and spatial memory (i). Error bars represent S.E.
FIGURE 4.
FIGURE 4.
Multiple Aβ-related metrics demonstrate coherent increase of multiple fractions of Aβ as a function of mouse age. Total protein was sequentially extracted from the brains of human AD patients and neurologically healthy individuals as well as from brains of several mouse strains of multiple ages (WT: 2, 3, 10, 12, 16, and 18 months; CRND8: 2, 5, and 10 months; 3× Tg: 4, 13, and 16 months; Tg2576: 3, 6, 10, 14, and 16 months; 5× FAD: 2 and 6 months; APP/PSEN1: 3, 6, 12, and 18 months). All the lysates were then assayed for Aβ levels using ELISA and immunoblotting. a, representative images of immunoblots used to assess the level of total Aβ in brain lysates after sequential extraction with TBS, TBSX, and FA. Monomeric preparation of synthetic Aβ at 32, 64, and 128 ng (missing in TBSX blots) were run alongside lysates to aid with absolute quantitation. Averaged results of WB immunoblot quantitation of Aβ in TBS and TBSX fractions (total soluble Aβ) are graphed in b. Levels of total soluble Aβ in increased with animal age in all model mice, although the accumulation rates varied: 5× FAD and CRND8 mice were accumulating Aβ much faster than APP/PSEN mice, whereas Tg2576 and 3× mice were slower Aβ accumulators. A similar discrepancy in Aβ accumulation rates was observed for the levels of soluble Aβ measured by ELISA (c) as well as levels of Aβ in formic acid-extracted material (d), average of quantitation of immunoblots on FA-extracted material and ELISA on FA-extracted material. Overall, levels of multiple subsets of Aβ increase in coherence as a function of mouse age. Error bars represent S.E.
FIGURE 5.
FIGURE 5.
Comparative histological characterization of amyloid plaque deposition in AD mice. a, slices from the brains of old APP/PSEN1 mice (12 months old) and old Tg2576 mice (18 months old) showed considerably higher levels of plaque burden compared with old 3× Tg (18 months old) mice both when stained with anti-Aβ antibody (top row of images) or ThT (bottom row of images). Neither young APP/PSEN1 (3 months) nor young Tg2576 (4 months) mice had any detectable plaques. Scale bar, 200 μm. b, quantification of staining intensities of Aβ immunostaining (b) and ThT staining (c).
FIGURE 6.
FIGURE 6.
Characterization of total Aβo accumulation in AD model mice. TBS brain lysates of WT (2, 3, 10, 12, 16, and 18 months), CRND8 (2, 5, and 10) months, 3× Tg (4, 13, and 16 months), Tg2576 (3, 6, 10, 14, and 16 months), 5× FAD (2, 4, and 6 months), and APP/PSEN1 (3, 6, 12, and 18 months) mice were analyzed by 82e1-8243 (a) and 8243-Nu4 (b) assays to quantify total amount of Aβo. Levels of total Aβo increased with animal age in all model mice, although the accumulation rates varied as follows: 5× FAD and CRND8 mice accumulated Aβo much faster than APP/PSEN and Tg2576 mice, whereas 3× mice were slower Aβ accumulators. c, table of correlations between mouse performance in behavioral tests and various Aβ-related biochemical metrics. PLISA is demonstrating the strongest significant correlation with progression of behavioral impairment across the panel of five AD mouse models. Error bars represent S.E.
FIGURE 7.
FIGURE 7.
ROC curve and contingency table analysis of predictive potential of various Aβ-related metrics. In ROC curve analysis PLISA is trending as the best predictor of deficit onset in both learning (a, quantified in c) and memory (b, quantified in d); however, this trend reaches significance only in comparison with Aβ monomer-specific ELISA. As described in Fig. 3, the normalized behavioral data are from in-house experiments (Tg2576, APP/PSEN1, 3× Tg) as well as literature data (5× FAD and CRND8 (65, 69, 70)).
FIGURE 8.
FIGURE 8.
PrPc-interacting Aβo is superior to other Aβ metrics in predicting cognitive impairment in AD model mice. Using the contingency table analysis, we have estimated that PrPC-interacting Aβ oligomers are better at predicting decline cognitive performance in AD mice both in form of spatial learning and spatial memory (a). As in Figs. 3 and 7, the normalized behavioral data are from in-house experiments (Tg2576, APP/PSEN1, 3× Tg) as well as literature data (5× FAD and CRND8 (65, 69, 70)). Soluble Aβ42 ELISA performed the worst in predicting spatial learning and spatial memory decline (b). Total soluble Aβ quantified by WB (c) and Aβ in FA-extracted fraction (d) demonstrated intermediate ability to predict behavioral deficit. Both 82e1-8243 and 8243-Nu4 ELISA (total Aβ) assays were acting as strong cognitive impairment predictors, although still lower than PLISA (e and f). Vertical dashed lines represent cutoffs for considering animals as cognitively impaired (0.5 for normalized spatial learning deficit, left graph in each series; 0.15 for normalized spatial memory deficit, right graph in each series). Horizontal dashed lines represent threshold Aβ concentrations where the animals were considered to be testing positive for the presence of respective Aβ species (minimal values observed in human AD patients were used as a reference here, resulting in the following cutoff values (in ng/g brain tissue): PrPc interacting Aβo, 2,45; soluble Aβ ELISA, 0.01; soluble Aβ WB, 26.26; FA-extracted Aβ, 725.86.
FIGURE 9.
FIGURE 9.
PrP-Fc affinity depletion of synaptotoxic activity from AD brain extracts specifically removes HMW but not low molecular weight Aβo species. The average levels of PrPC-interacting Aβo and total Aβo in mice with developed behavioral deficits were only twice higher than the ones observed in human AD patients (a). In contrast, levels of soluble ELISA-detectable Aβ- and FA-extractable Aβ were, respectively, ∼50 and ∼20 times higher in mice than in humans. Total soluble Aβ measured by WB was ∼4 times higher in mice than in humans. The relative fraction of PrPC-interacting Aβo in the total Aβo pool was significantly higher in APP/PSEN1 and CRND8 than in 3× and Tg2576 mice, whereas 5× FAD mice had an intermediate relative amount of PrPC-interacting Aβo (b and c). To investigate the relative potency of PrP-interacting and PrP-inert Aβo, pooled TBS brain extracts from AD patients (n = 6) were affinity-depleted of PrPC-interacting Aβ by incubation with PrP-Fc-Sepharose. Fc-conjugated resin was used for nonspecific pulldown control, whereas pooled extracts from the brains of neurologically healthy patients (n = 5) were used as disease-negative control. PrP-Fc pulldown resulted in complete elimination of PLISA activity from AD samples, whereas incubation with the noncoupled resin did not change PLISA activity level or size distribution by SEC relative to pre-pulldown values (d and e). The levels of total Aβo measured by 82e1-8243 total Aβo assay after PrP-Fc pulldown were decreased but not eliminated (f). Total Aβo was also measured by 82e1-8243 assay after SEC fractionation of affinity chromatography fractions (g). PrP-Fc affinity resin removed the majority of total Aβo from early eluting HMW fractions. Western blot analysis (h, quantified in i) of affinity-depleted and negative control lysates further demonstrates the nonhomogeneity of HMW amyloid oligomers as only a part of HMW immunoreactivity is depleted from AD samples after PrP resin incubation. Because the focus was on oligomeric Aβ, the membrane was not boiled, and the monomeric Aβ band remains faint. Error bars represent S.E.
FIGURE 10.
FIGURE 10.
Short term γ-secretase inhibition does not reduce oligomeric Aβ levels. a, 12-month-old APP/PSEN1 mice were treated with LY-411575 (n = 4, red bars) or vehicle (n = 5, black bars). Neither of the Aβo assays (PLISA or 82e1-8243) detected a significant change in soluble amyloid oligomers. No significant difference was observed in FA-soluble Aβ by Aβ40 and Aβ42 ELISAs; an insignificant increase in FA-soluble Aβ was observed by Western blot (p = 0.083). Levels of monomeric soluble Aβ40 and Aβ42 were reduced significantly in LY-411575-treated group (mAβ40 TBS: p = 0.004; mAβ40 TBSX: p = 0.002; mAβ42 TBS: p < 0.001), and mAβ42 TBSX showed a strong trend toward decrease (p = 0.057). Levels of C99 fragment of APP were increased dramatically in LY-411575-treated mice indicating drug effectiveness. Blots (anti-Aβ 8243) used for quantitation of C99 APP fragment and FA-soluble Aβ are shown in (b and c), respectively. Error bars represent S.E.
FIGURE 11.
FIGURE 11.
Genetic deletion of PrPC improves learning and memory in Tg2576 transgenic mice. Spatial learning is plotted as the time necessary to find a hidden platform in the Morris water maze at 4 months of age. Data are presented as means ± S.E. WT control n = 32, WT PRNP−/− n = 15, Tg2576 control n = 31, Tg2576 PRNP−/− n = 25. Performance did not differ throughout the experiment (p > 0.05) as determined by a repeated measures ANOVA. (a, p > 0.05). The platform is removed for a probe trial 24 h after the training in the Morris water maze was completed. Time spent in the target quadrant and anti-target quadrant was measured. Random chance is 25%. Data are presented as means ± S.E. for the mice from a. At this age, all groups showed a strong preference for the target quadrant over the anti-target quadrant with there being no difference in performance among the groups (p > 0.05) as determined by an ANOVA (b, Student's t test, *, p < 0.05; ***, p < 0.001; n.s., not significant). The mice were again trained in a Morris water maze paradigm except toward a different hidden platform location. Spatial learning is plotted as latency. WT control n = 28, WT PRNP−/− n = 11, Tg2576 control n = 22, Tg2576 PRNP−/− n = 20. Performance did not differ throughout the experiment (c, p > 0.05). Mice performed a probe trial 24 h after the training in the Morris water maze was completed. Time spent in the target quadrant and anti-target quadrant was measured. Random chance is 25%. Data are presented as mean ± S.E. for the mice from c. Tg2576 mice are impaired as the animals do not show a preference for the target quadrant, although all other groups strongly prefer the target quadrant (*, p < 0.05) as determined by an ANOVA and Fisher's LSD for post hoc analysis. d, *. p < 0.05; **, p < 0.01). Spatial learning is plotted as the time necessary to find a hidden platform in a new third location in the Morris water maze at 18 months of age. WT control n = 24, WT PRNP−/− n = 11, Tg2576 control n = 21,Tg2576 PRNP−/− n = 14. By repeated measures ANOVA for swim blocks 4–6 with post hoc pairwise testing and Tukey correction for multiple tests, both the Tg2576 with and without PrPC differed from control mice as indicated (p < 0.05). Mice performed a probe trial 24 h after the training in the Morris water maze was completed. Time spent in the target quadrant and anti-target quadrant was measured. Random chance is 25%. Data are presented as mean ± S.E. for the mice from e. The Tg2576 control mice continue to have a deficit in the probe trial as they spend significantly less time in the target quadrant than WT mice, although Tg2576 PRNP−/− mice do not perform differently from WT mice as determined by an ANOVA and Fisher's LSD for post hoc analysis (f, p < 0.05).
FIGURE 12.
FIGURE 12.
Threshold level of PrPC-interacting Aβo for development of cognitive deficits in AD model mice. The time of onset of symptomatic behavioral impairment varies dramatically between different AD model mouse strains. However, all of the transgenic AD mice as well human AD patients start to show manifestations of behavioral decline when their level of PrPC-interacting Aβo is reaching certain threshold value, ∼2–5 ng/g of brain tissue. The subthreshold values might result in mild forms of cognitive impairment too subtle to measure with usual behavioral tests and thus puts animals with subthreshold amount of PrPc-interacting Aβo in a diagnostic gray zone.

References

    1. Mayeux R. (2003) Epidemiology of neurodegeneration. Annu. Rev. Neurosci. 26, 81–104 - PubMed
    1. Braak H., Braak E. (1991) Neuropathological stageing of Alzheimer-related changes. Acta Neuropathol. 82, 239–259 - PubMed
    1. Blennow K., de Leon M. J., Zetterberg H. (2006) Alzheimer's disease. Lancet 368, 387–403 - PubMed
    1. Arendt T. (2009) Synaptic degeneration in Alzheimer's disease. Acta Neuropathol. 118, 167–179 - PubMed
    1. Prince M., Bryce R., Albanese E., Wimo A., Ribeiro W., Ferri C. P. (2013) The global prevalence of dementia: a systematic review and metaanalysis. Alzheimer's Dementia 9, 63–75 - PubMed

Publication types

MeSH terms