. 2015 Jul 10;290(28):17321-30.
doi: 10.1074/jbc.M115.652123. Epub 2015 May 27.

Adaptive Engineering of Phytochelatin-based Heavy Metal Tolerance

Affiliations

Adaptive Engineering of Phytochelatin-based Heavy Metal Tolerance

Rebecca E Cahoon et al. J Biol Chem. .

Abstract

Metabolic engineering approaches are increasingly employed for environmental applications. Because phytochelatins (PC) protect plants from heavy metal toxicity, strategies directed at manipulating the biosynthesis of these peptides hold promise for the remediation of soils and groundwaters contaminated with heavy metals. Directed evolution of Arabidopsis thaliana phytochelatin synthase (AtPCS1) yields mutants that confer levels of cadmium tolerance and accumulation greater than expression of the wild-type enzyme in Saccharomyces cerevisiae, Arabidopsis, or Brassica juncea. Surprisingly, the AtPCS1 mutants that enhance cadmium tolerance and accumulation are catalytically less efficient than wild-type enzyme. Metabolite analyses indicate that transformation with AtPCS1, but not with the mutant variants, decreases the levels of the PC precursors, glutathione and γ-glutamylcysteine, upon exposure to cadmium. Selection of AtPCS1 variants with diminished catalytic activity alleviates depletion of these metabolites, which maintains redox homeostasis while supporting PC synthesis during cadmium exposure. These results emphasize the importance of metabolic context for pathway engineering and broaden the range of tools available for environmental remediation.

Keywords: enzyme catalysis; heavy metal tolerance; metabolic engineering; plant biochemistry; plant molecular biology; protein engineering.


Figures

FIGURE 1.
FIGURE 1.
Phytochelatin structure and synthesis. A, general structure of a representative PC. The example shown is PC2, which contains two γEC repeats. The core structures of PCs consist of 2–15 γEC repeats derived from glutathione (GSH) by the transfer of a γEC unit from one GSH molecule to another or by the transfer of γEC units from GSH to pre-existent PCs. PCs have the general structure (γEC)xX, where X is usually Gly. B, the overall reaction catalyzed by PCS is a heavy metal, for instance Cd2+-, activated dipeptidyl transfer reaction in which PC chain extension proceeds in the N to C direction.
FIGURE 2.
FIGURE 2.
Cd2+ tolerance, PC accumulation, and Cd2+ accumulation in yeast strain DTY167 heterologously expressing wild-type or mutant variants of AtPCS1::FLAG. A, Cd2+ sensitivity of S. cerevisiae ycf1Δ strain DTY167 transformed with pYES3 (Vec), pYES3-AtPCS1::FLAG (AtPCS1), or pYES-AtPCS1::FLAG constructs carrying AtPCS1 mutations. B, RP-HPLC analysis of PCs extracted from yeast strain DTY167 transformed with pYES3-AtPCS1::FLAG (blue) or pYES3-AtPCS1-Y186C::FLAG (red) after growth for 2 h in liquid media containing 250 μm CdCl2. Peaks labeled as PC2–5 were identified by MALDI-TOF MS in negative ion mode. C, Western analysis of the FLAG tag in yeast strain DTY167 transformants expressing wild-type or mutant AtPCS1::FLAG. Aliquots (20 μg of protein) of the soluble fractions were separated by SDS-PAGE, electrotransferred to nitrocellulose membranes, and probed with anti-FLAG M2 antibody. The Mr 55,000 AtPCS1::FLAG polypeptide was the major immunoreactive band. D, comparison of cellular Cd2+ contents of yeast strain DTY167 transformed with empty pYES3 vector (white), pYES3-AtPCS1::FLAG (black), pYES3-AtPCS1-C109Y::FLAG (red), or pYES3-AtPCS1-Y186C::FLAG (blue) after growth for 24 h in liquid media containing 0, 50, or 250 μm CdCl2. The histogram in the left-hand panel is Cd2+ content (μg) per 107 cells; the histogram in the right-hand panel is Cd2+ content of the total culture cell mass. Values shown are mean ± S.E. (n = 3).
FIGURE 3.
FIGURE 3.
Effect of heterologously expressed wild-type and mutant AtPCS1 on the Cd2+ sensitivity of S. cerevisiae ycf1Δ strain DTY 167. Yeast strain DTY167 was transformed with empty pYES3 vector (closed circles) or with pYES3 containing either the AtPCS1::FLAG insert (pYES3-AtPCS1::FLAG; open circles) or the mutant AtPCS1-Y186C::FLAG insert (pYES3-AtPCS1-Y186C::FLAG; closed squares). Cd2+ sensitivity was assessed in liquid media containing the indicated concentrations of CdCl2 as described under “Experimental Procedures.”
FIGURE 4.
FIGURE 4.
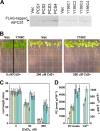
Effects of ectopic expression of AtPCS1::FLAG or AtPCS1-Y186C::FLAG in Arabidopsis on Cd2+ tolerance, PC accumulation, and Cd2+ accumulation. A, Western analysis of FLAG-tagged AtPCS1 in pART27-AtPCS1::FLAG transformants (transgenic lines PCS1, PCS2, PCS3, and PCS4) and pART27-AtPCS-Y186C::FLAG transformants (transgenic lines Y186C1, Y186C2, Y186C3, and Y186C4). Equal amounts (20 μg) of the total soluble protein extracted from the seedlings were separated by SDS-PAGE, electrotransferred, and probed with anti-FLAG M2 antibody to detect FLAG-tagged protein. Plants transformed with empty pART27 vector (Vec) were used as a control. B, Cd2+ sensitivity of Arabidopsis lines transformed with pART27 (Vec) or pART27-AtPCS1-Y186C::FLAG (Y186C). Seeds from T2 generation Arabidopsis transformants were germinated on standard MS plates and after 5 days seedlings were transferred to vertical MS plates containing 0 or 200 μm CdCl2 for growth for a further 14 days, after which time root length was measured. C, root growth of Arabidopsis seedlings transformed with pART27 (white), pART27-AtPCS1::FLAG (green), or pART27-AtPCS1-Y186C::FLAG (blue). Seeds were germinated on standard MS plates and after 5 days seedlings were transferred to vertical MS places containing 0, 50, or 200 μm CdCl2. The growth conditions were as described in B. Values shown are mean ± S.E. (n = 25–30). D, analysis of PC contents (left) and Cd2+ accumulation (right) of pART27 (white), pART27-AtPCS1::FLAG (green), and pART27-AtPCS1-Y186C4::FLAG (blue) transformants of Arabidopsis. Levels of PC2–5 and Cd2+ in the homogenates of whole seedlings were determined by RP-HPLC and atomic absorption spectrometry, respectively, after growth for 10 days on MS plates containing 100 μm CdCl2. Values shown are mean ± S.E. (n = 3–5).
FIGURE 5.
FIGURE 5.
Effects of AtPCS1::FLAG or AtPCS1-Y186C::FLAG expression in B. juncea on Cd2+ tolerance, PC accumulation, and Cd2+ accumulation. A, Western analysis of AtPCS1::FLAG (transgenic lines PCS1–4) and AtPCS-Y186C::FLAG mutant (transgenic lines MUT1–4) expression in transgenic B. juncea plants. Equal amounts (20 μg) of the total soluble protein extracted from the seedlings were separated by SDS-PAGE, electrotransferred, and probed with anti-FLAG M2 antibody to detect FLAG-tagged proteins. Plants transformed with empty vector (Vec) were included as a control. B, Cd2+ sensitivity of B. juncea lines transformed with pART27 (vec), pART27-AtPCS1::FLAG (PCS1) or pART27-AtPCS1-Y186C::FLAG (MUT1, MUT4). The seedlings shown are derived from seeds grown for 7 days on MS plates containing 200 μm CdCl2. C, root length of B. juncea seedlings transformed with pART27 (white), pART27-AtPCS1::FLAG (green), or pART27-AtPCS1-Y186C(MUT4)::FLAG (blue) after growth on MS plates containing 0, 100, or 200 μm CdCl2. Values shown are mean ± S.E. (n = 20–30). D, fresh weight comparison of B. juncea seedlings transformed with pART27 (white), pART27-AtPCS1::FLAG (green; transgenic lines PCS1–4), or pART27-AtPCS1-Y186C::FLAG (blue; transgenic lines MUT1–4). Seeds were germinated on MS plates and the seedlings transferred to MS plates containing 0, 100, or 200 μm CdCl2. After 7 days, the fresh weight (FW) of each seedling was measured. Values shown are mean ± S.E. (n = 20–30). E, analysis of PC contents (left) and Cd2+ accumulation (right) of pART27 (white), pART27-AtPCS1::FLAG (green), and pART27-AtPCS1-Y186C(MUT4)::FLAG (blue) transformants of B. juncea. The total levels of PC2–5 and Cd2+ in the homogenates of whole seedlings were determined by RP-HPLC and atomic absorption spectrometry, respectively, after growth for 7 days on MS plates containing 200 μm CdCl2. Values shown are mean ± S.E. (n = 3–5).
FIGURE 6.
FIGURE 6.
Purification, kinetic analysis, and homology modeling of AtPCS1. A, purification of His-tagged AtPCS1. Aliquots (20 μg of protein) of the soluble fractions from crude sonicates of E. coli BL21(DE3) cells expressing His-AtPCS1 (sonicate) and the protein after nickel-affinity (Ni-NTA) and size-exclusion chromatography (S200) were subjected to SDS-PAGE and stained for total protein with Coomassie Blue (Bio-Rad). The position of His-AtPCS1 at Mr 55,000 is indicated. Similar results were obtained for all of the His-tagged AtCS1 variants examined. B, GSH concentration dependence of PC synthesis catalyzed by His-AtPCS1 and His-AtPCS-Y186C. The assays were performed as described and the synthesis of PC2 was monitored for 10 min at 30 °C in 100 mm BTP-HEPES buffer (pH 8.0) containing 300 μm CdCl2, and the indicated concentrations of GSH. C, structural model of the N-terminal catalytic domain of AtPCS1. A homology model of the N-terminal domain, encompassing Leu11-Ser217, was generated from the crystal structure of the prokaryotic PCS homolog Nostoc GSH hydrolyase (25) (Protein Data Bank 2BU3) using the Phyre2 Protein Fold Recognition Server version 2.0. Each mutated residue in the AtPCS1 variants identified in the yeast cadmium selection screens is indicated. Also shown is the γEC unit donated by the first GSH substrate to generate the enzyme acyl-intermediate formed in the first phase of the catalytic cycle, which was modeled from Protein Data Bank code 2BU3 (25), as well as the location of the putative binding site of the second substrate, GSH (38).
FIGURE 7.
FIGURE 7.
Model for adaptive evolution of PC biosynthesis before and after transformation with wild-type or mutant PCS. GSH biosynthesis catalyzed by glutamate-cysteine ligase (GCL) and glutathione synthetase (GS) provides substrates for PCS. Heavy metal activation of PCS elicits the synthesis of PCs and basal level tolerance (black). Overexpression of wild-type PCS leads to oxidative stress through the depletion by GSH and/or γEC and heavy metal hypersensitivity in some plants (orange). Overexpression of mutant PCS variants with diminished enzymatic activity, but with wild-type heavy metal activation, maintains GSH and γEC levels and enhances heavy metal tolerance (green).

Similar articles

Cited by

References

    1. Johnson M. D., Kenney N., Stoica A., Hilakivi-Clarke L., Singh B., Chepko G., Clarke R., Sholler P. F., Lirio A. A., Foss C., Reiter R., Trock B., Paik S., Martin M. B. (2003) Cadmium mimics the in vivo effects of estrogen in the uterus and mammary gland. Nature Med. 9, 1081–1084 - PubMed
    1. Salt D. E., Smith R. D., Raskin I. (1998) Phytoremediation. Annu. Rev. Plant Physiol. Plant Mol. Biol. 49, 643–668 - PubMed
    1. Lassner M., Bedbrook J. (2001) Directed molecular evolution in plant improvement. Curr. Opin. Plant Biol. 4, 152–156 - PubMed
    1. Rugh C. L., Wilde H. D., Stack N. M., Thompson D. M., Summers A. O., Meagher R. B. (1996) Mercuric ion reduction and resistance in transgenic Arabidopsis thaliana plants expressing a modified bacterial merA gene. Proc. Natl. Acad. Sci. U.S.A. 93, 3182–3187 - PMC - PubMed
    1. Bizily S. P., Rugh C. L., Meagher R. B. (2000) Phytodetoxification of hazardous organomercurials by genetically engineered plants. Nat. Biotechnol. 18, 213–217 - PubMed

Publication types

MeSH terms

Associated data

LinkOut - more resources