. 2015 Aug;89(16):8162-81.
doi: 10.1128/JVI.00469-15. Epub 2015 May 27.

Involvement of the Rac1-IRSp53-Wave2-Arp2/3 Signaling Pathway in HIV-1 Gag Particle Release in CD4 T Cells

Affiliations

Involvement of the Rac1-IRSp53-Wave2-Arp2/3 Signaling Pathway in HIV-1 Gag Particle Release in CD4 T Cells

Audrey Thomas et al. J Virol. 2015 Aug.

Abstract

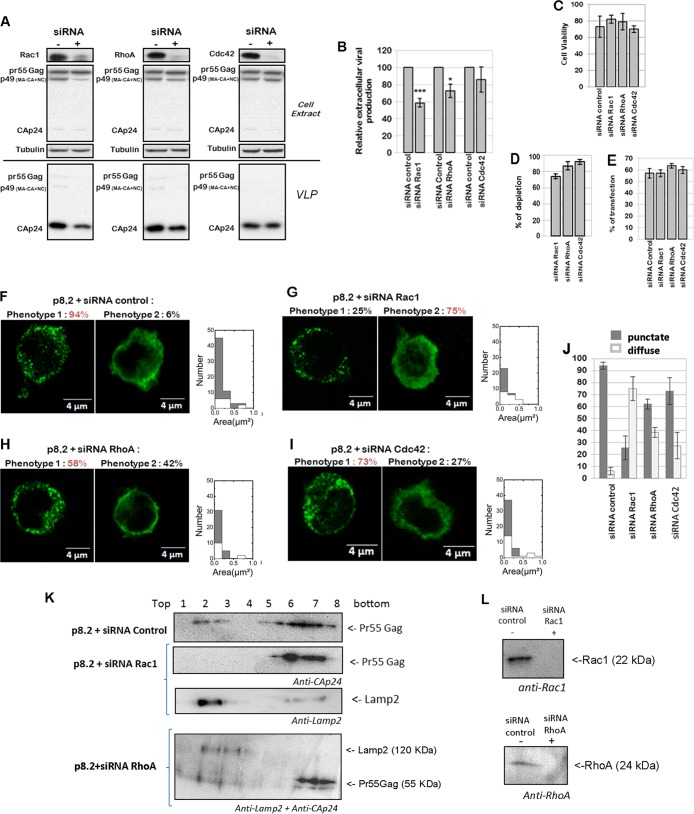
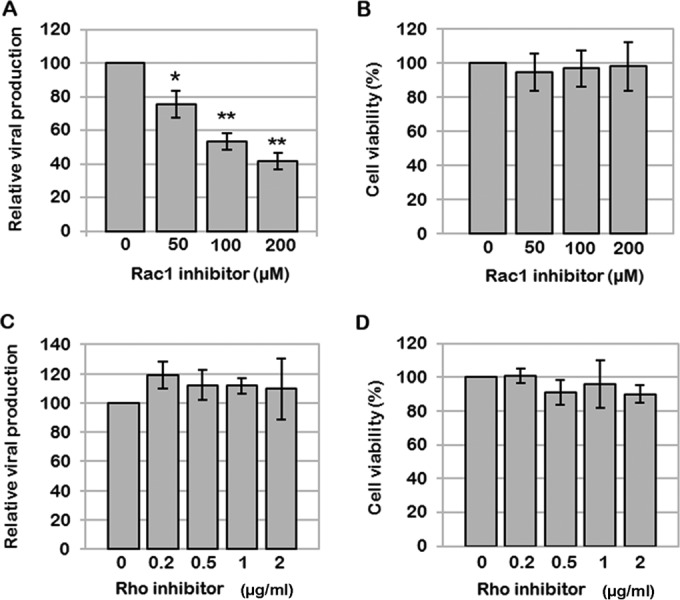
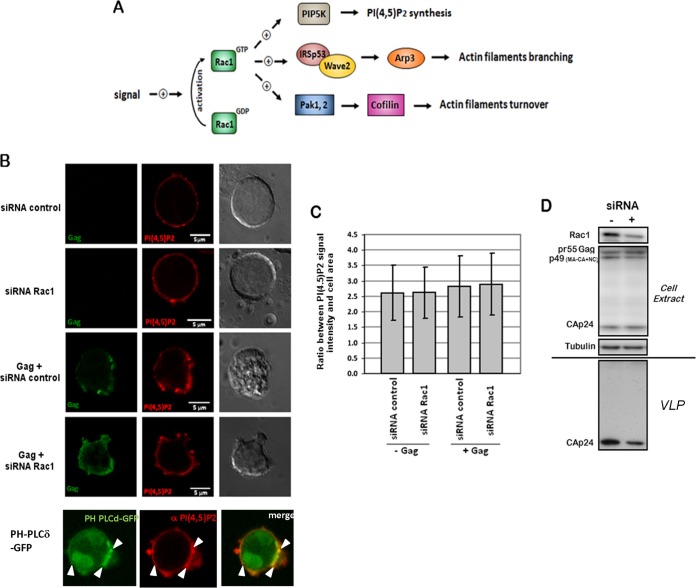
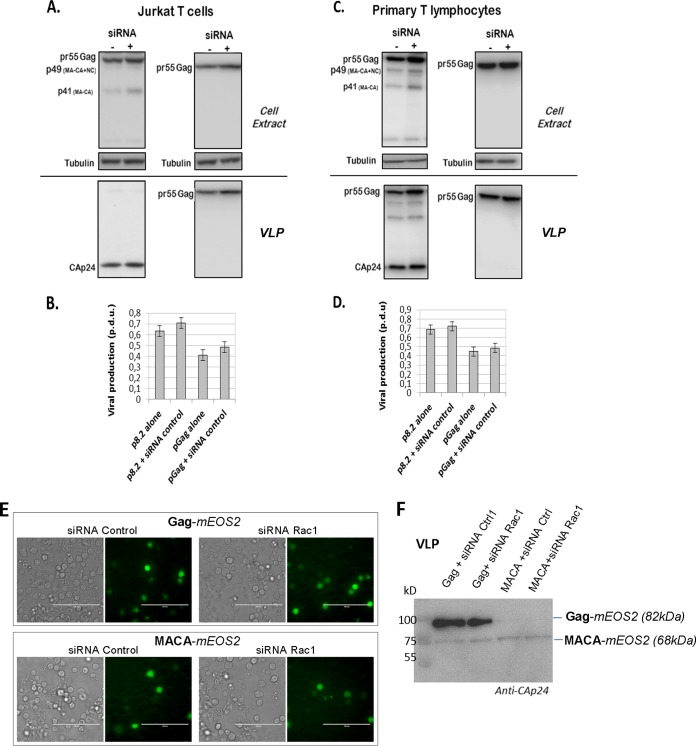
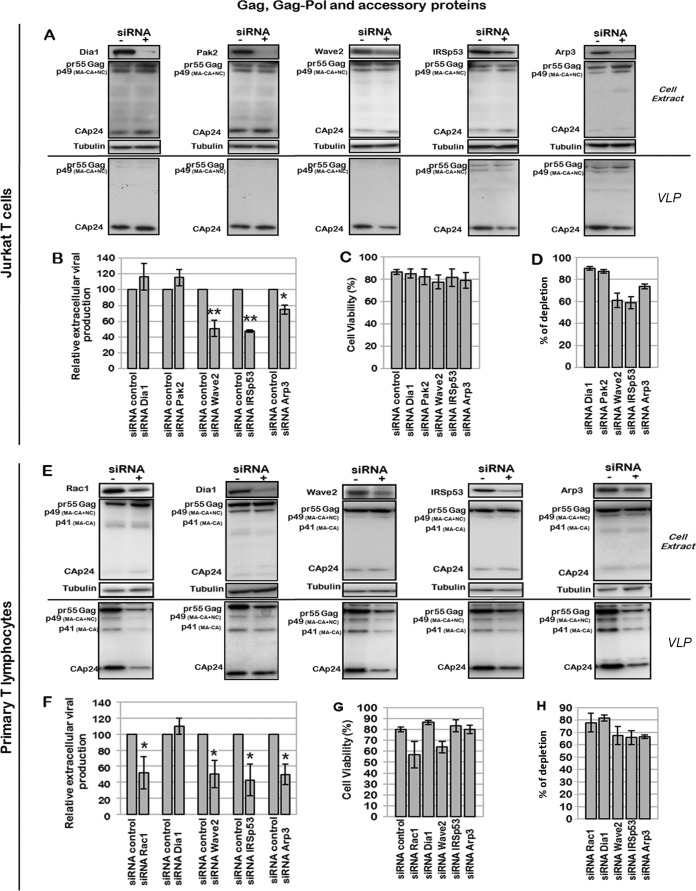
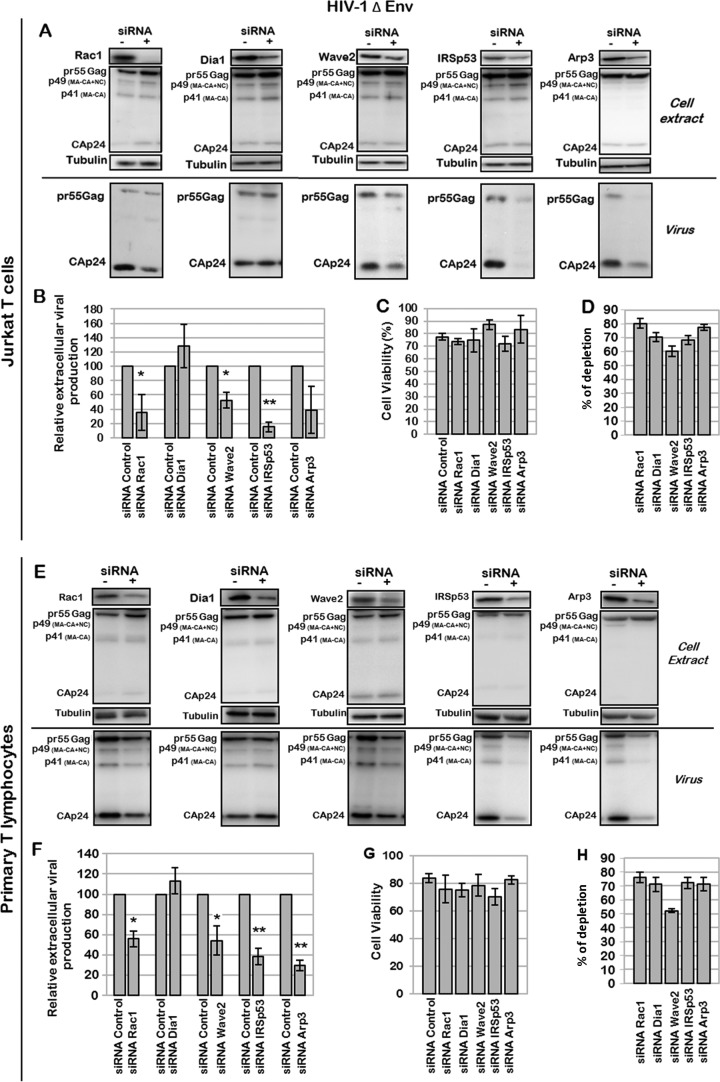
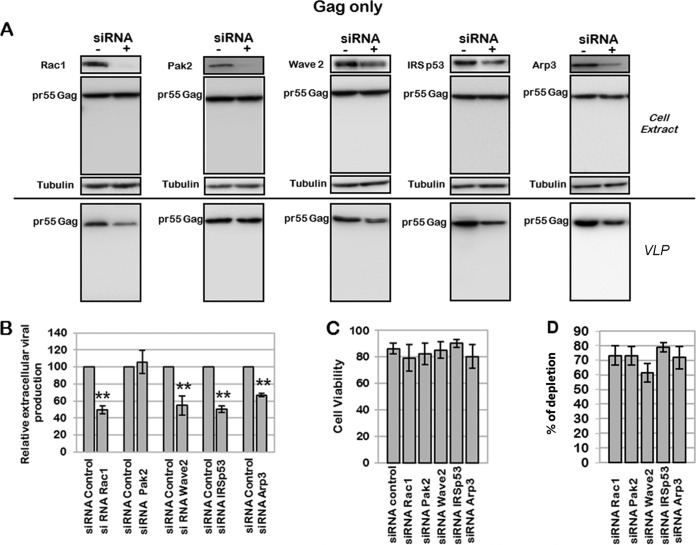
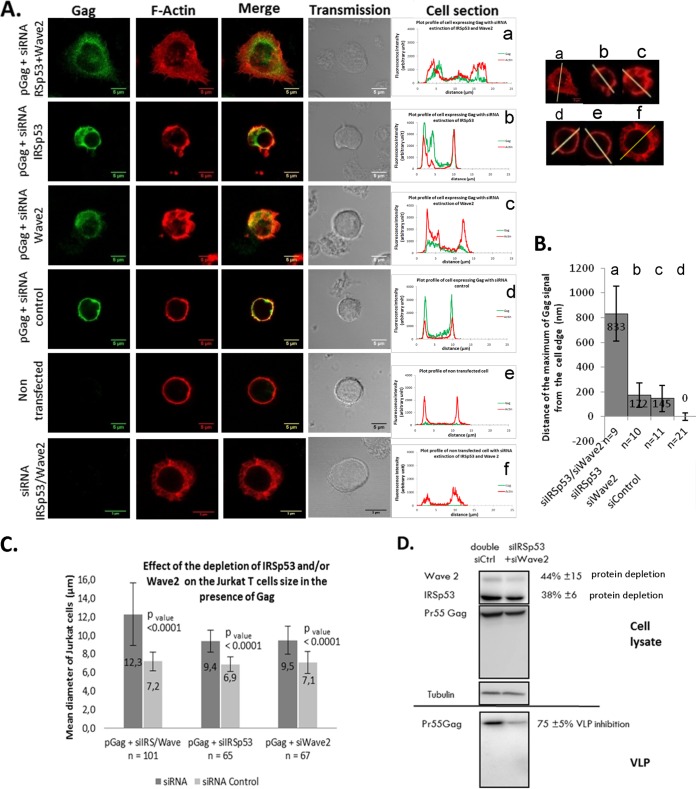
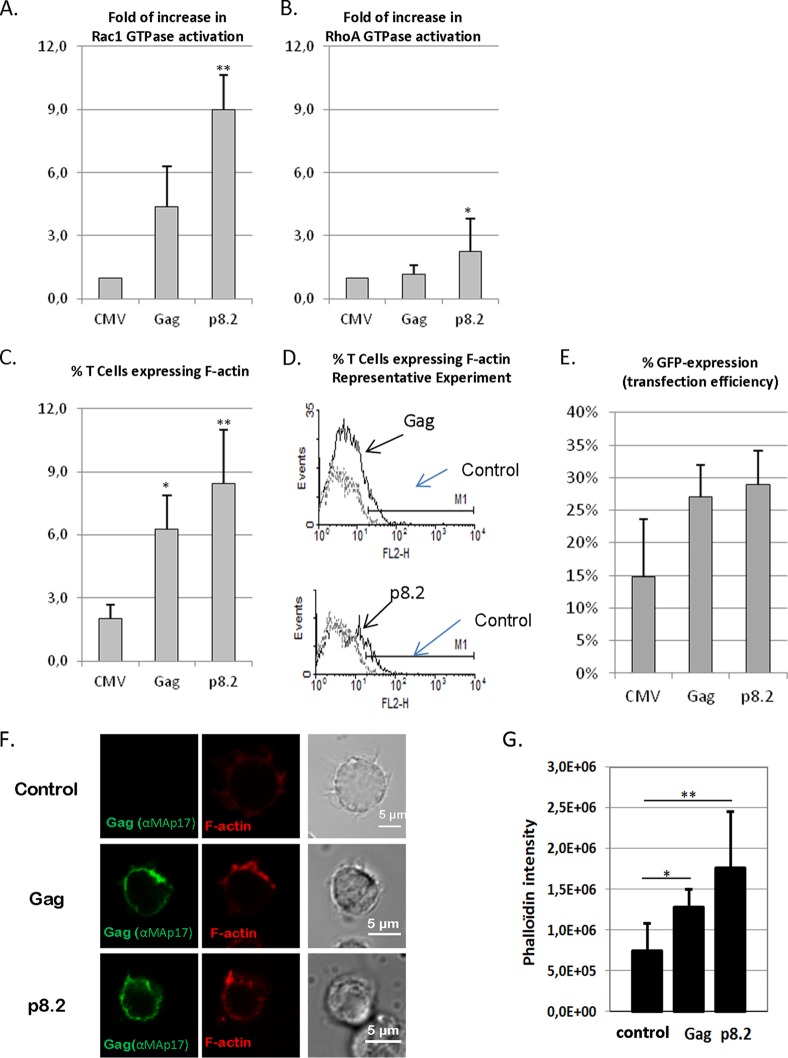
During HIV-1 assembly, the Gag viral proteins are targeted and assemble at the inner leaflet of the cell plasma membrane. This process could modulate the cortical actin cytoskeleton, located underneath the plasma membrane, since actin dynamics are able to promote localized membrane reorganization. In addition, activated small Rho GTPases are known for regulating actin dynamics and membrane remodeling. Therefore, the modulation of such Rho GTPase activity and of F-actin by the Gag protein during virus particle formation was considered. Here, we studied the implication of the main Rac1, Cdc42, and RhoA small GTPases, and some of their effectors, in this process. The effect of small interfering RNA (siRNA)-mediated Rho GTPases and silencing of their effectors on Gag localization, Gag membrane attachment, and virus-like particle production was analyzed by immunofluorescence coupled to confocal microscopy, membrane flotation assays, and immunoblot assays, respectively. In parallel, the effect of Gag expression on the Rac1 activation level was monitored by G-LISA, and the intracellular F-actin content in T cells was monitored by flow cytometry and fluorescence microscopy. Our results revealed the involvement of activated Rac1 and of the IRSp53-Wave2-Arp2/3 signaling pathway in HIV-1 Gag membrane localization and particle release in T cells as well as a role for actin branching and polymerization, and this was solely dependent on the Gag viral protein. In conclusion, our results highlight a new role for the Rac1-IRSp53-Wave2-Arp2/3 signaling pathway in the late steps of HIV-1 replication in CD4 T lymphocytes.

Importance: During HIV-1 assembly, the Gag proteins are targeted and assembled at the inner leaflet of the host cell plasma membrane. Gag interacts with specific membrane phospholipids that can also modulate the regulation of cortical actin cytoskeleton dynamics. Actin dynamics can promote localized membrane reorganization and thus can be involved in facilitating Gag assembly and particle formation. Activated small Rho GTPases and effectors are regulators of actin dynamics and membrane remodeling. We thus studied the effects of the Rac1, Cdc42, and RhoA GTPases and their specific effectors on HIV-1 Gag membrane localization and viral particle release in T cells. Our results show that activated Rac1 and the IRSp53-Wave2-Arp2/3 signaling pathway are involved in Gag plasma membrane localization and viral particle production. This work uncovers a role for cortical actin through the activation of Rac1 and the IRSp53/Wave2 signaling pathway in HIV-1 particle formation in CD4 T lymphocytes.


Figures

FIG 1
FIG 1
Effect of Rho GTPase depletion on VLP production, Gag intracellular localization, and Gag membrane attachment in T cells. (A to E) Effect of Rac1, RhoA, and Cdc42 depletion on VLP production. Jurkat T cells were transfected with p8.2 (expression of Gag, Gag-Pol, and accessory viral proteins) and with the siRNA control or siRNA against Rac1, RhoA, or Cdc42. (A) Immunoblot analysis for detection of the HIV-1 proteins pr55Gag and CAp24 in cell lysates and in VLPs. Tubulin was used as a loading control. (B) Extracellular virus production measured by quantification of immunoblot images, i.e., the ratio between extracellular CAp24 and intracellular Pr55 Gag + CAp24. Bars show mean values and standard deviations resulting from three independent experiments. The statistical significances of differences were calculated by an unpaired t test. **, P value of <0.01; *, P value of <0.05. (C) Cell viability measured by flow cytometry analysis. (D) Quantification of Rho GTPase depletion after siRNA treatment. (E) Percent transfection measured by flow cytometry analysis. Bars show mean values and standard deviations resulting from three independent experiments. (F to J) Effect of Rac1, RhoA, and Cdc42 depletion on Gag intracellular localization. Jurkat T cells were transfected with p8.2 and with the siRNA control (F), siRNA against Rac1 (G), siRNA against RhoA (H), or siRNA against Cdc42 (I). Cells were fixed at 48 h posttransfection, permeabilized, stained for HIV-1 Gag, and analyzed by confocal microscopy. (J) Percentage of cells with each phenotype, calculated for 50 cells. Bars show mean values and standard deviations resulting from three independent experiments. (K and L) Effect of Rac1 or RhoA depletion on Gag cell membrane attachment. Jurkat T cells were microporated with p8.2 and with the siRNA control or siRNA against Rac1 or against RhoA. Cells were then lysed, and the PNS was used for membrane flotation assays. Intracellular proteins of each gradient fraction were loaded onto an SDS-PAGE gel. (K) The viral Gag and Lamp2 proteins were then revealed by immunoblotting, as indicated. (L) Rac1 and RhoA depletion by siRNA knockdown, in the PNS, shown by anti-Rac1 and anti-RhoA immunoblots, respectively.
FIG 2
FIG 2
Effects of the Rac1 inhibitor NSC23766 and the Rho inhibitor CT04 on VLP production. Jurkat T cells were transfected with p8.2 and treated 24 h later with different concentrations of a Rac1-specific inhibitor or the Rho inhibitor CT04. (A and B) Effect of the Rac1-specific inhibitor NSC23766 on VLP production. (A) After 10 h of treatment, virus production was analyzed by a reverse transcription assay. Bars show mean values and standard deviations resulting from three independent experiments. The statistical significances of differences were calculated by an unpaired t test. **, P value of <0.01; *, P value of <0.05. (B) Cell viability measured by using trypan blue. (C and D) Effect of the Rho inhibitor CT04 on VLP production. (C) After drug treatment, virus production was analyzed by a reverse transcription assay. Bars show mean values and standard deviations resulting from three independent experiments. (D) Cell viability measured by using trypan blue.
FIG 3
FIG 3
Effect of siRNA-mediated depletion of Rac1 on intracellular PI(4,5)P2 levels in Jurkat T cells. (A) Rac1-dependent cell signaling pathways having an effect on actin filament dynamics. In T cells, Rac1 GTPase plays an important role in the regulation of actin cytoskeleton rearrangement. Indeed, on one hand, in response to extracellular signals, Rac1 is activated and could stimulate actin filament turnover by the intermediate of the Pak1 (or Pak2)-LIMK-cofilin pathway. On the other hand, activated Rac1 could also stimulate actin filament branching in lamellipodia. In the latter case, IRSp53 is recruited by Rac1 and binds the proline-rich region of Wave2. As a result, Wave2 is activated and induces actin branching via Arp2/3 complex recruitment. In a third case, Rac1-GTP could also activate the phosphatidylinositol-4-phosphate 5-kinase (PIP5K), which catalyzes the synthesis of PI(4,5)P2 at the cell plasma membrane. (B to D) Effect of siRNA-mediated depletion of Rac1 on intracellular PI(4,5)P2 levels. (B) Cells were transfected with pCMV-LacZ, p8.2 (Gag, Gag-Pol, and viral accessory proteins), or PH-phospholipase C delta (PLCδ)-GFP, together with the siRNA control or siRNA against Rac1, as indicated. At 48 h posttransfection, cells were fixed, permeabilized, and stained with anti-MAp17 and anti-PI(4,5)P2 antibodies. The colocalization of the GFP-tagged PH domain of phospholipase C delta and the PI(4,5)P2 antibody is indicated as a control for PI(4,5)P2-enriched membrane domains (white arrows). (C) The ratio of the PI(4,5)P2 signal intensity to the cell area was measured by image analysis (ImageJ) (n = 20 cells). (D) Immunoblot analysis of Rac1 GTPase and HIV-1 Gag in cell lysates and/or in virus particles. Tubulin was used as a loading control.
FIG 4
FIG 4
Effect of siRNA microporation on production of mature and immature VLPs. Jurkat T cells or PBLs were microporated with p8.2 or pGag without any siRNA (−) or with control siRNA (+). (A and C) Immunoblot analysis of pr55Gag and CAp24 in cell lysates and in VLPs of Jurkat T cells (A) or primary T lymphocytes (C). Tubulin was using as a loading control. (B and D) Extracellular VLP production was measured by quantification of immunoblot images, corresponding to the ratio of extracellular pr55Gag or CAp24 to intracellular pr55Gag. Bars show mean values and standard deviations resulting from three independent experiments. p.d.u., protein detectable unit. (E and F) Control analysis of Gag and MACA VLP production. (E) Visualization of Jurkat T cells expressing mEOS2-tagged Gag or MACA with the corresponding siRNA by fluorescence and transmission microscopy (bar = 100 μm). (F) Immunoblots (anti-CAp24) of VLPs of Jurkat T cells expressing mEOS2-tagged Gag (82 kDa) or mEOS2-tagged MACA (68 kDa) together with the siRNA control or siRNA against Rac1, at 48 h postmicroporation.
FIG 5
FIG 5
Effect of Rac1-dependent cell signaling and the Wave2 multicomplex on virus assembly and mature VLP production. (A to D) Effect of Dia1, Pak2, Wave2, IRSp53, and Arp3 depletion on virus assembly and mature particle production. Jurkat T cells were transfected with p8.2 (Gag, Gag-Pol, and viral accessory proteins) and with the siRNA control or siRNA against Dia1, Pak2, Wave2, IRSp53, or Arp3. (A) Immunoblot analysis of HIV-1 pr55Gag and CAp24 in cell lysates and in virus particles. Tubulin was used as a loading control. (B) Extracellular virus production measured by quantification of immunoblot images, corresponding to the ratio of extracellular CAp24 to intracellular pr55Gag and CAp24. Bars show mean values and standard deviations resulting from three independent experiments. The statistical significances of differences were calculated by an unpaired t test. **, P value of <0.01; *, P value of <0.05. (C) Cell viability measured by using trypan blue. (D) Quantification of protein depletion after siRNA treatment. Bars show mean values and standard deviations resulting from three independent experiments. (E to H) Effect of the Rac1-Wave2-IRSp53-Arp3 cell signaling pathway on virus assembly and mature particle production in primary T lymphocytes (PBLs). PBLs were transfected with p8.2 and with the siRNA control or siRNA against Rac1, IRSp53, Wave2, or Arp3. (E) Immunoblot analysis of HIV-1 pr55Gag and CAp24 in cell lysates and in virus particles. Tubulin was used as a loading control. (F) Extracellular virus production measured as described above for panel C. Bars show mean values and standard deviations resulting from two independent experiments. (G) Cell viability measured by using trypan blue. (H) Quantification of protein depletion after siRNA treatment.
FIG 6
FIG 6
Effect of Rac1-dependent cell signaling on production of Env-deleted HIV-1 particles. (A to D) Effect of Rac1, Dia1, Wave2, IRSp53, or Arp3 depletion on production of mature particles. Jurkat T cells were transfected with pNL4.3ΔEnv and with the siRNA control or siRNA against Rac1, Dia1, Wave2, IRSp53, or Arp3. (A) Immunoblot analysis of pr55Gag and CAp24 in cell lysates and in virus particles. Tubulin was used as a loading control. (B) Extracellular virus production measured by quantification of immunoblot images, corresponding to the ratio of extracellular CAp24 to intracellular pr55Gag and CAp24. Bars show mean values and standard deviations resulting from two independent experiments. The statistical significances of differences were calculated by an unpaired t test. **, P value of <0.01; *, P value of <0.05. (C) Cell viability measured by using trypan blue. (D) Quantification of protein depletion after siRNA treatment by using ImageJ software, relative to the tubulin loading control. Bars show mean values and standard deviations resulting from three independent experiments. (E to H) Effect of Rac1, Dia1, Wave2, IRSp53, or Arp3 depletion on production of mature particles in PBLs. PBLs were transfected with pNL4.3ΔEnv and with the siRNA control or siRNA against Rac1, Dia1, Wave2, IRSp53, or Arp3. (E) Immunoblot analysis of HIV-1 pr55Gag and CAp24 in cell lysates and in virus particles. Tubulin was using as a loading control. (F) Extracellular virus production calculated as described above for panel B. Bars show mean values and standard deviations resulting from two independent experiments. (G) Cell viability measured by dead cell counting using trypan blue. (H) Quantification of protein depletion after siRNA treatment.
FIG 7
FIG 7
Effect of siRNA targeting the Wave2 multicomplex on Gag VLP production. Jurkat T cells were transfected with pGag and with the siRNA control or siRNA against Rac1, Pak2, Wave2, IRSp53, or Arp3. (A) Immunoblot analysis of pr55Gag in cell lysates and in viral particles. Tubulin was using as a loading control. (B) Extracellular virus production measured by quantification of immunoblot images, corresponding to the ratio of extracellular pr55Gag to intracellular pr55Gag. Bars show mean values and standard deviations resulting from four independent experiments. The statistical significances of differences were calculated by an unpaired t test. **, P value of <0.01. (C) Cell viability evaluated by dead cell counting using trypan blue. (D) Quantification of protein depletion after siRNA treatment. Bars show mean values and standard deviations resulting from four independent experiments.
FIG 8
FIG 8
Effect of a partial double knockdown of IRSp53/Wave2 by siRNA on HIV-1 Gag localization and VLP release in T cells. (A) Jurkat T cells were transfected with the vector pGag (HIV-1 Gag expression) (a to d) or pCMV-LacZ (control) (e and f), together with a mix of siRNA (Wave2 and IRSp53) (a and f) or a mix of control siRNAs (d). The cells were fixed and stained for F-actin (phalloidin-Alexa 546) (red) and Gag (anti-MAp17-Alexa 488) (green). Merge and transmission images are presented. The cell sections show Gag and F-actin fluorescent signals at the cell periphery. (B) Distance of the maximum Gag fluorescent signal from the cell edge (determined by the actin signal) under each condition (n = 9 to 21 cells). (C) Cell mean diameters (in micrometers) of the different cell transfection conditions, as indicated. The effect of the depletion of IRSp53 and/or Wave2 on Jurkat T-cell sizes compared to those of siRNA control-treated cells, in the presence of Gag, is shown. (D) Immunoblot analysis of pr55Gag in T-cell lysates and in VLPs. On the right are the average percentages of depletion of each protein and of inhibition of VLP release from three independent experiments. Tubulin was used as a loading control.
FIG 9
FIG 9
Effect of Gag on Rac1 and RhoA activation and on F-actin content in T cells. Jurkat T cells were microporated with a control plasmid or pGag (HIV-1 Gag expression) or p8.2 (expression of Gag, Gag-Pol, and viral accessory proteins), together with the pCMV-GFP plasmid, which was used to normalize the microporation efficiency. (A and B) Effect of Gag on Rac1 and RhoA activation. Data shown are representative of data from three independent experiments. Rac1 (A) and RhoA (B) activation was measured by G-LISA. Data shown indicate the fold increases of GTPase activation regarding activation in Jurkat T cells expressing the control plasmid. * and ** indicate P values of <0.05 and 0.01, respectively. (C to E) Effect of Gag on F-actin content in Jurkat T cells as determined by flow cytometry. F-actin expression was measured by flow cytometry analysis in cells simultaneously fixed and permeabilized and then stained with phalloidin-Alexa 546. (C) Median percentages of cells expressing F-actin and standard deviations, which were calculated for Gag- or p8.2-microporated T cells compared to the GFP expression levels in control cells (microporated with pCMV-GFP), from seven independent experiments. (D) Data from a representative flow cytometry experiment. The continuous line represents F-actin fluorescence in T cells microporated with pGag or p8.2, and the discontinuous line is the control (T cells microporated with pCMV-GFP). * and ** indicate P values of <0.05 and 0.01, respectively. (E) Transfection efficiency was monitored by the percentage of GFP expression in each experiment. Values are averages of data from seven independent experiments. (F and G) Effect of Gag on F-actin content in Jurkat T cells, as determined by immunofluorescence imaging. Cells were transfected with pCMV-LacZ (control), pGag (encoding HIV-1 Gag), or p8.2 (encoding Gag, Gag-Pol, and accessory proteins). At 24 h posttransfection, Jurkat T cells were harvested, fixed, permeabilized, and stained with anti-MAp17 antibodies and phalloidin-Alexa 546. The left panels show images from a representative experiment. (G)The phalloidin intensity in Jurkat T cells under each condition was measured by image analysis (ImageJ) (n = 20 cells). The histogram shows the results obtained. * and ** indicate P values of <0.05 and 0.01, respectively.

Similar articles

Cited by

References

    1. Corbin A, Grigorov B, Roingeard P, Darlix J, Muriaux D. 2008. Revisiting HIV-1 assembly. Med Sci (Paris) 24:49–55. (In French.) doi:10.1051/medsci/200824149. - DOI - PubMed
    1. Grigorov B, Arcanger F, Roingeard P, Darlix J, Muriaux D. 2006. Assembly of infectious HIV-1 in human epithelial and T-lymphoblastic cell lines. J Mol Biol 359:848–862. doi:10.1016/j.jmb.2006.04.017. - DOI - PubMed
    1. Joshi A, Ablan SD, Soheilian F, Nagashima K, Freed EO. 2009. Evidence that productive human immunodeficiency virus type 1 assembly can occur in an intracellular compartment. J Virol 83:5375–5387. doi:10.1128/JVI.00109-09. - DOI - PMC - PubMed
    1. Jouve M, Sol-Foulon N, Watson S, Schwartz O, Benaroch P. 2007. HIV-1 buds and accumulates in “nonacidic” endosomes of macrophages. Cell Host Microbe 2:85–95. doi:10.1016/j.chom.2007.06.011. - DOI - PubMed
    1. Ono A, Freed EO. 2004. Cell-type-dependent targeting of human immunodeficiency virus type 1 assembly to the plasma membrane and the multivesicular body. J Virol 78:1552–1563. doi:10.1128/JVI.78.3.1552-1563.2004. - DOI - PMC - PubMed

Publication types

MeSH terms