

An Islet-Targeted Genome-Wide Association Scan Identifies Novel Genes Implicated in Cytokine-Mediated Islet Stress in Type 2 Diabetes
- PMID: 26018251
- PMCID: PMC4541617
- DOI: 10.1210/en.2015-1203
An Islet-Targeted Genome-Wide Association Scan Identifies Novel Genes Implicated in Cytokine-Mediated Islet Stress in Type 2 Diabetes
Abstract
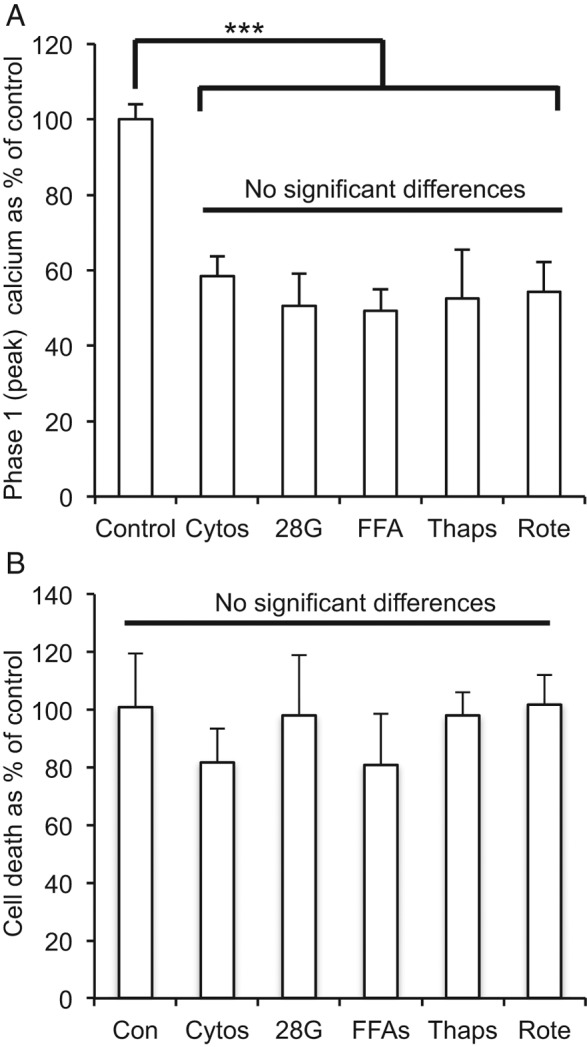
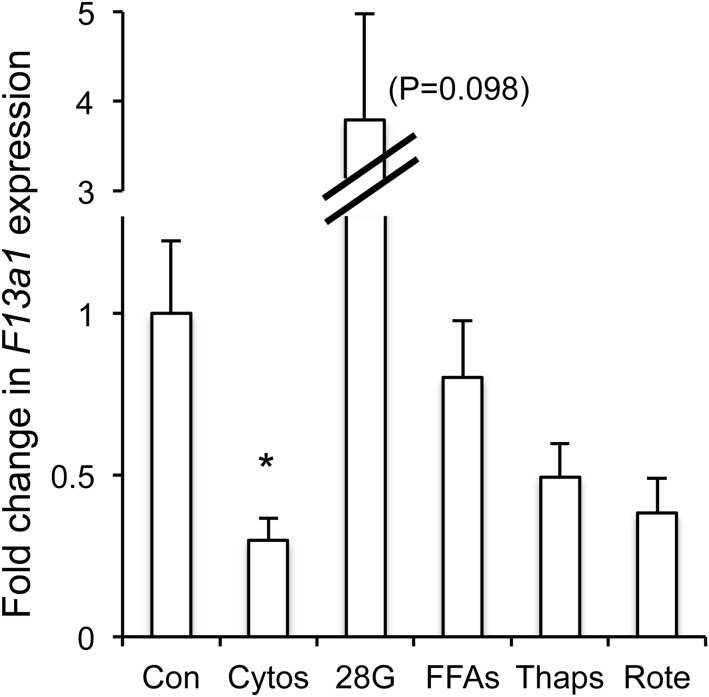
Genome-wide association studies in human type 2 diabetes (T2D) have renewed interest in the pancreatic islet as a contributor to T2D risk. Chronic low-grade inflammation resulting from obesity is a risk factor for T2D and a possible trigger of β-cell failure. In this study, microarray data were collected from mouse islets after overnight treatment with cytokines at concentrations consistent with the chronic low-grade inflammation in T2D. Genes with a cytokine-induced change of >2-fold were then examined for associations between single nucleotide polymorphisms and the acute insulin response to glucose (AIRg) using data from the Genetics Underlying Diabetes in Hispanics (GUARDIAN) Consortium. Significant evidence of association was found between AIRg and single nucleotide polymorphisms in Arap3 (5q31.3), F13a1 (6p25.3), Klhl6 (3q27.1), Nid1 (1q42.3), Pamr1 (11p13), Ripk2 (8q21.3), and Steap4 (7q21.12). To assess the potential relevance to islet function, mouse islets were exposed to conditions modeling low-grade inflammation, mitochondrial stress, endoplasmic reticulum (ER) stress, glucotoxicity, and lipotoxicity. RT-PCR revealed that one or more forms of stress significantly altered expression levels of all genes except Arap3. Thapsigargin-induced ER stress up-regulated both Pamr1 and Klhl6. Three genes confirmed microarray predictions of significant cytokine sensitivity: F13a1 was down-regulated 3.3-fold by cytokines, Ripk2 was up-regulated 1.5- to 3-fold by all stressors, and Steap4 was profoundly cytokine sensitive (167-fold up-regulation). Three genes were thus closely associated with low-grade inflammation in murine islets and also with a marker for islet function (AIRg) in a diabetes-prone human population. This islet-targeted genome-wide association scan identified several previously unrecognized candidate genes related to islet dysfunction during the development of T2D.
Figures


References
-
- Weir GC, Bonner-Weir S. Five stages of evolving β-cell dysfunction during progression to diabetes. Diabetes 2004;53(suppl 3):S16–S21. - PubMed
-
- Leahy JL, Hirsch IB, Peterson KA, Schneider D. Targeting β-cell function early in the course of therapy for type 2 diabetes mellitus. J Clin Endocrinol Metab. 2010;95:4206–4216. - PubMed
-
- Diabetes Genetics Initiative of Broad Institute of Harvard and MIT, Lund University, Novartis Institutes of BioMedical Research, et al. Genome-wide association analysis identifies loci for type 2 diabetes and triglyceride levels. Science. 2007;316:1331–1336. - PubMed
-
- Roduit R, Morin J, Masse F, et al. Glucose down-regulates the expression of the peroxisome proliferator-activated receptor-α gene in the pancreatic β-cell. J Biol Chem. 2000;275:35799–35806. - PubMed
-
- Robertson RP, Harmon J, Tran PO, Poitout V. β-cell glucose toxicity, lipotoxicity, and chronic oxidative stress in type 2 diabetes. Diabetes. 2004;53(suppl 1):S119–S124. - PubMed
Publication types
MeSH terms
Substances
Grants and funding
- R01 DK089182/DK/NIDDK NIH HHS/United States
- R01 DK085175/DK/NIDDK NIH HHS/United States
- R01DK089182/DK/NIDDK NIH HHS/United States
- R01 DK061628/DK/NIDDK NIH HHS/United States
- HL47902/HL/NHLBI NIH HHS/United States
- HL047890/HL/NHLBI NIH HHS/United States
- HL047887/HL/NHLBI NIH HHS/United States
- HL060919/HL/NHLBI NIH HHS/United States
- UL1 TR000124/TR/NCATS NIH HHS/United States
- R01 HL060944/HL/NHLBI NIH HHS/United States
- K01DK081621/DK/NIDDK NIH HHS/United States
- DK085175/DK/NIDDK NIH HHS/United States
- U01 HL047902/HL/NHLBI NIH HHS/United States
- P30 DK063491/DK/NIDDK NIH HHS/United States
- K01 DK081621/DK/NIDDK NIH HHS/United States
- R01 HL061019/HL/NHLBI NIH HHS/United States
- HL060944/HL/NHLBI NIH HHS/United States
- HL047889/HL/NHLBI NIH HHS/United States
- DK061628/DK/NIDDK NIH HHS/United States
- R01 HL060919/HL/NHLBI NIH HHS/United States
- HL061019/HL/NHLBI NIH HHS/United States
LinkOut - more resources
Full Text Sources
Other Literature Sources
Medical
Molecular Biology Databases
Miscellaneous
