. 2015 Dec;42(6):1611-22.
doi: 10.1002/jmri.24952. Epub 2015 May 27.

Detecting the effects of Fabry disease in the adult human brain with diffusion tensor imaging and fast bound-pool fraction imaging

Affiliations

Detecting the effects of Fabry disease in the adult human brain with diffusion tensor imaging and fast bound-pool fraction imaging

Hunter R Underhill et al. J Magn Reson Imaging. 2015 Dec.

Abstract

Background: To identify quantitative MRI parameters associated with diffusion tensor imaging (DTI) and fast bound-pool fraction imaging (FBFI) that may detect alterations in gray matter and/or white matter in adults with Fabry disease, a lysosomal storage disorder.

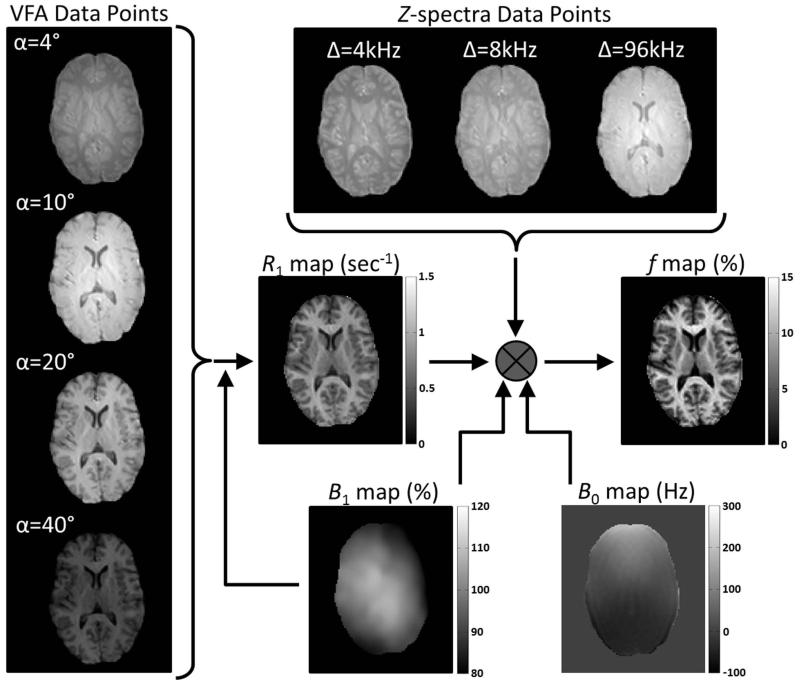
Materials and methods: Twelve healthy controls (mean age ± standard deviation: 48.0 ± 12.4 years) and 10 participants with Fabry disease (46.7 ± 12.9 years) were imaged at 3.0 Tesla. Whole-brain parametric maps of diffusion tensor metrics (apparent diffusion coefficient [ADC] and fractional anisotropy [FA]) and the bound-pool fraction (f) were acquired. Mean voxel values of parametric maps from regions-of-interest within gray and white matter structures were compared between cases and controls using the independent t-test. Spearman's rho was used to identify associations between parametric maps and age.

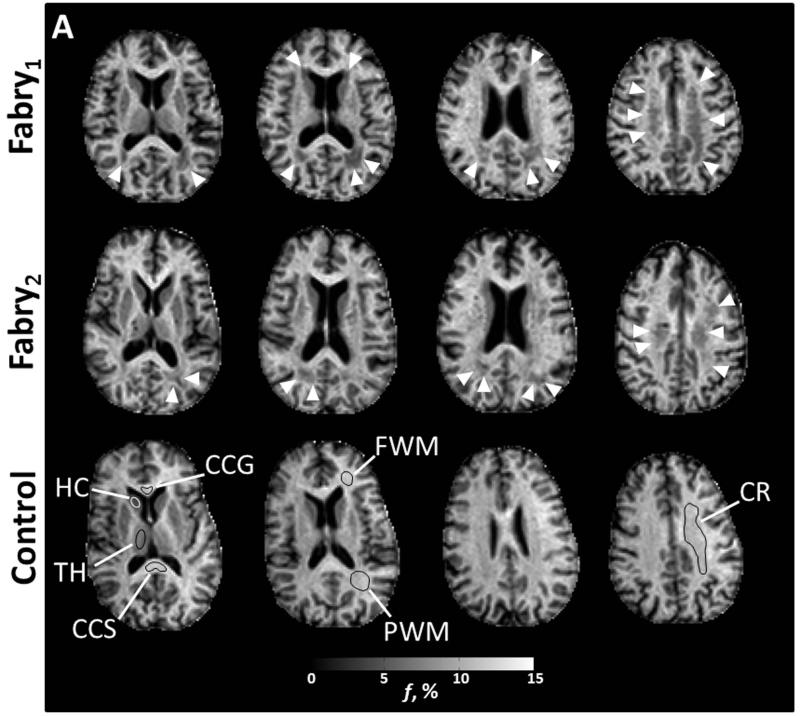
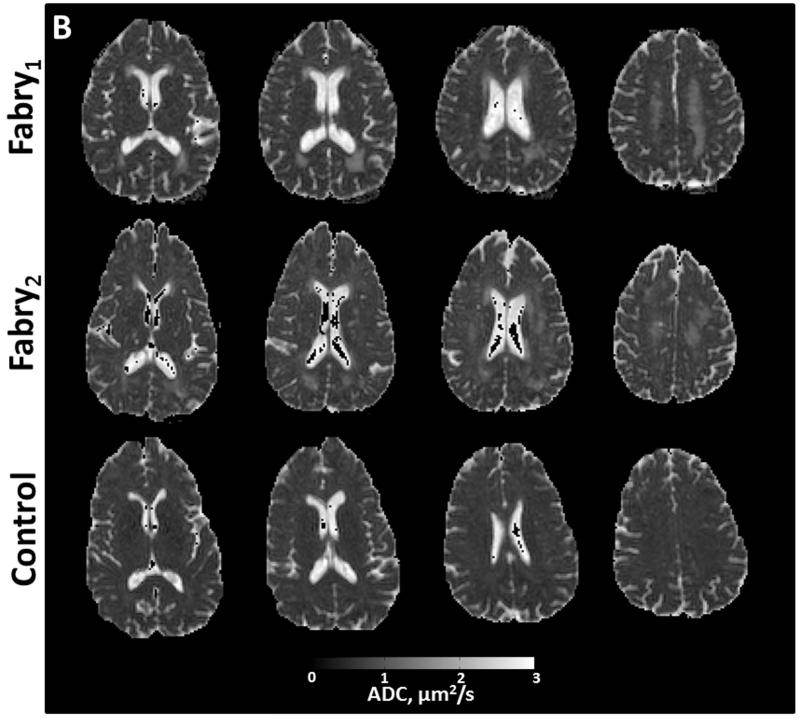
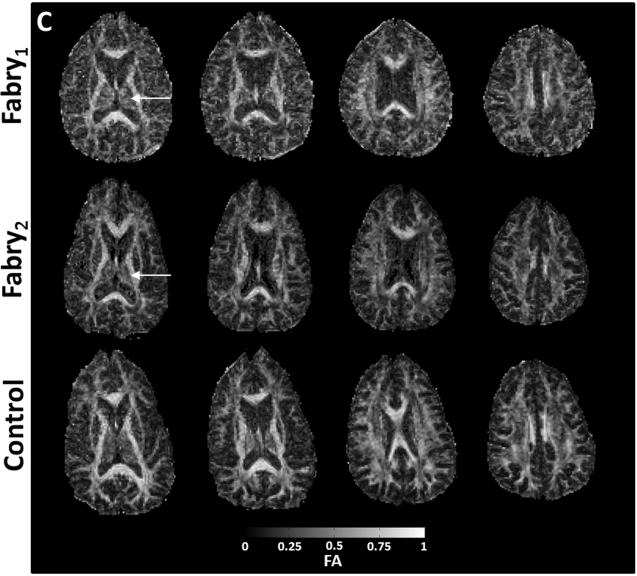
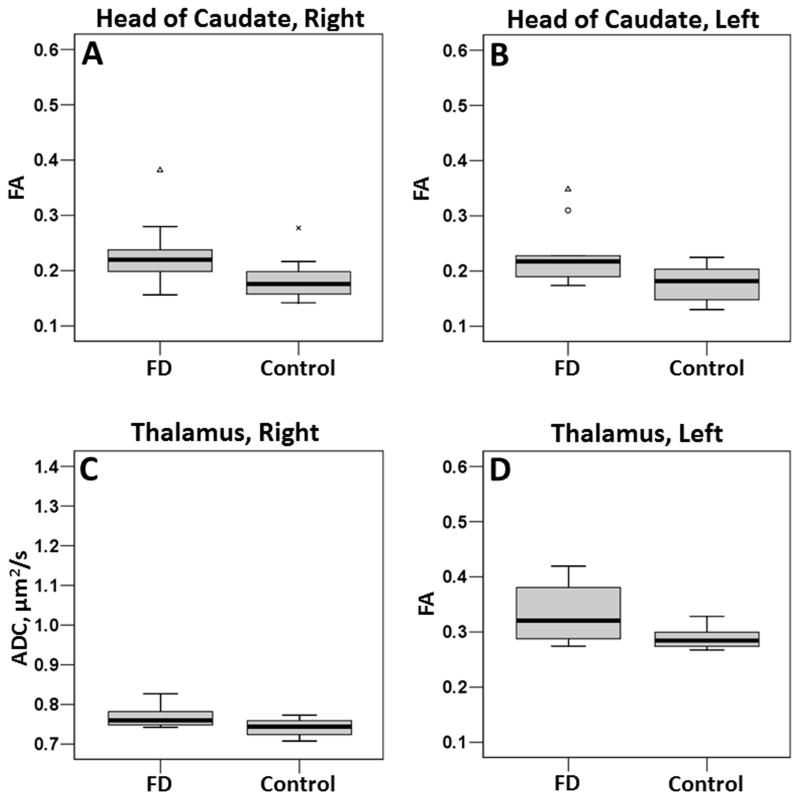
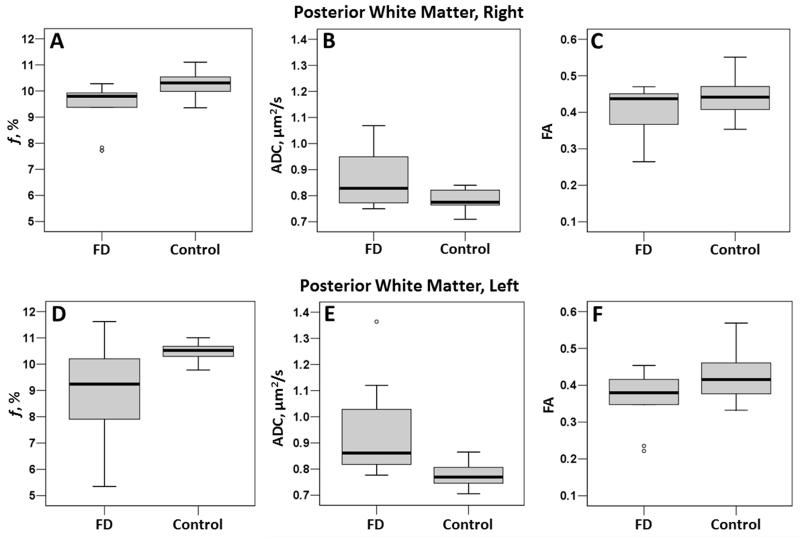
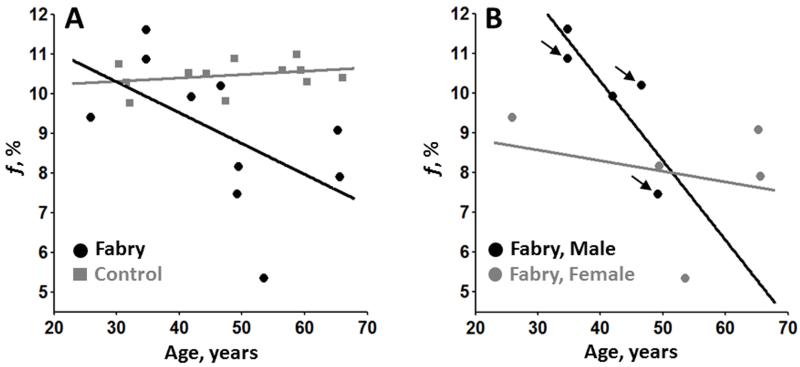
Results: Compared with controls, the left thalamus of Fabry participants had an increase in FA (0.29 ± 0.02 versus 0.33 ± 0.05, respectively; P = 0.030) and a trend toward an increase in ADC (0.73 ± 00.02 versus 0.76 ± 0.03 μm(2) /s, respectively; P = 0.082). The left posterior white matter demonstrated a reduction in f (10.45 ± 0.37 versus 9.00 ± 1.84%, respectively; P = 0.035), an increase in ADC (0.78 ± 0.04 versus 0.94 ± 0.19 μm(2) /s, respectively; P = 0.024), and a trend toward a reduction in FA (0.42 ± 0.07 versus 0.36 ± 0.08, respectively; P = 0.052). Among all parameters, only f measured in the left posterior white matter was significantly associated with age in Fabry participants (rho = -0.71; P = 0.022).

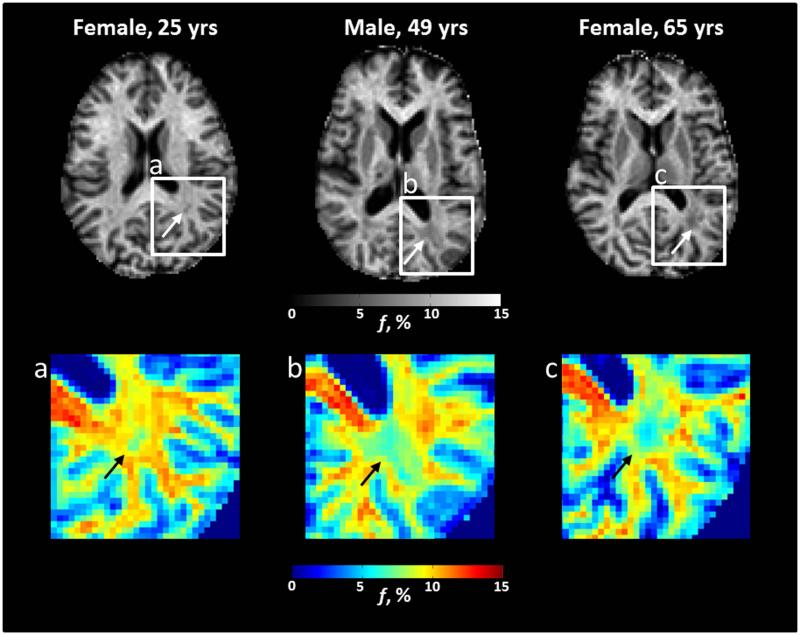
Conclusion: Parameters derived from DTI and FBFI detect Fabry-related changes in the adult human brain, particularly in the posterior white matter where reductions in myelin density as measured by FBFI appear age related.

Keywords: Fabry disease; bound-pool fraction; diffusion tensor imaging; magnetization transfer; quantitative MRI; white matter disease.


Figures

Figure 1
Figure 1
Requisite images from a control participant (male, 29 years) for voxel-based production of f maps. VFA and Z-spectra acquisition flip angles (α) are corrected with B1 maps during calculation of R1 maps and f maps, respectively. The production of f maps also requires correction of Z-spectra offset frequencies (Δ) with B0 maps and utilization of R1 maps.
Figure 2
Figure 2
Axial images from two participants with Fabry disease (Fabry1, female, 53 years; Fabry2, male, 49 years) and a control participant (female, 59 years). Anatomic structures are identified in f maps for the control participant with representative ROIs (A). In the participants with Fabry disease, there is a substantial reduction in the bound pool fraction (A, white arrow heads). An increase in ADC (B) is present in corresponding anatomic locations. White matter changes in the Fabry participant may be less apparent in the fractional anisotropy (FA) images (C) due to heterogenous fiber direction in some structures such as the posterior white matter (PWM) and corona radiata (CR). In gray matter, particularly the left thalamus, there is evidence of increased restricted anisotropy on FA (C, white arrows) in the Fabry participant. CCG = corpus callosum, genu; CCS = corpus callosum, splenium; FWM = frontal white matter; HC = head of caudate; TH = thalamus
Figure 2
Figure 2
Axial images from two participants with Fabry disease (Fabry1, female, 53 years; Fabry2, male, 49 years) and a control participant (female, 59 years). Anatomic structures are identified in f maps for the control participant with representative ROIs (A). In the participants with Fabry disease, there is a substantial reduction in the bound pool fraction (A, white arrow heads). An increase in ADC (B) is present in corresponding anatomic locations. White matter changes in the Fabry participant may be less apparent in the fractional anisotropy (FA) images (C) due to heterogenous fiber direction in some structures such as the posterior white matter (PWM) and corona radiata (CR). In gray matter, particularly the left thalamus, there is evidence of increased restricted anisotropy on FA (C, white arrows) in the Fabry participant. CCG = corpus callosum, genu; CCS = corpus callosum, splenium; FWM = frontal white matter; HC = head of caudate; TH = thalamus
Figure 3
Figure 3
Boxplots for the head of caudate (A, B) and thalamus (C, D). All boxplots are of FA except for C, which is of ADC. To compare the spread of data, scaling for each parameter is identical to the scaling in Figure 4.
Figure 4
Figure 4
Boxplots for the posterior white matter, right (top row) and left (bottom row). Note the large spread of bound pool fraction data in the left posterior WM in participants with Fabry disease (D).
Figure 5
Figure 5
Scatter plots of age vs. bound pool fraction in the left posterior white matter. Solid black/gray lines represent a regression line through corresponding black/gray data points. In (A), there is a reduction of myelin density with age in Fabry participants (black circles) compared to controls (gray squares) that is also present regardless of gender (B). The black arrows (B) identify Fabry participants with a history of stroke.
Figure 6
Figure 6
Axial bound-pool fraction maps (f maps) from participants with Fabry disease. There is evidence in the left posterior white matter for a gradual decrease in myelin density (white arrows) with age that may be more apparent on corresponding color maps (a-c, black arrows). Specifically, there is a trend from yellow/red towards light and dark blue with increasing age.

References

    1. Mehta A, Clarke JT, Giugliani R, et al. Natural course of Fabry disease: changing pattern of causes of death in FOS - Fabry Outcome Survey. J Med Genet. 2009;46(8):548–52. - PubMed
    1. Crutchfield KE, Patronas NJ, Dambrosia JM, et al. Quantitative analysis of cerebral vasculopathy in patients with Fabry disease. Neurology. 1998;50(6):1746–9. - PubMed
    1. Moore DF, Ye F, Schiffmann R, Butman JA. Increased signal intensity in the pulvinar on T1-weighted images: a pathognomonic MR imaging sign of Fabry disease. Ajnr. 2003;24(6):1096–101. - PMC - PubMed
    1. Jardim L, Vedolin L, Schwartz IV, et al. CNS involvement in Fabry disease: clinical and imaging studies before and after 12 months of enzyme replacement therapy. J Inherit Metab Dis. 2004;27(2):229–40. - PubMed
    1. Fellgiebel A, Muller MJ, Mazanek M, Baron K, Beck M, Stoeter P. White matter lesion severity in male and female patients with Fabry disease. Neurology. 2005;65(4):600–2. - PubMed

Publication types