. 2015 Jun 1;29(11):1106-19.
doi: 10.1101/gad.260554.115. Epub 2015 May 27.

PDGFRα signaling drives adipose tissue fibrosis by targeting progenitor cell plasticity

Affiliations

PDGFRα signaling drives adipose tissue fibrosis by targeting progenitor cell plasticity

Tomoaki Iwayama et al. Genes Dev. .

Abstract

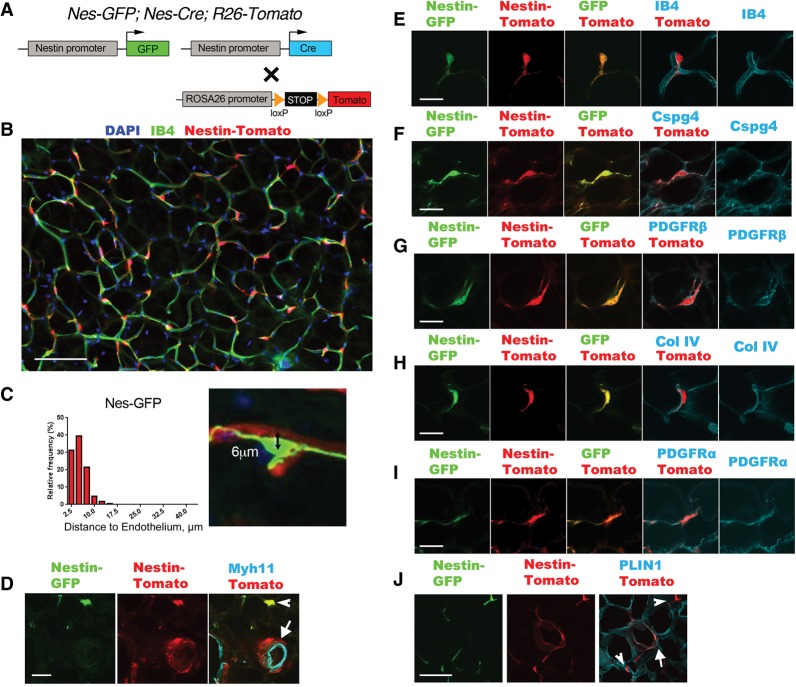
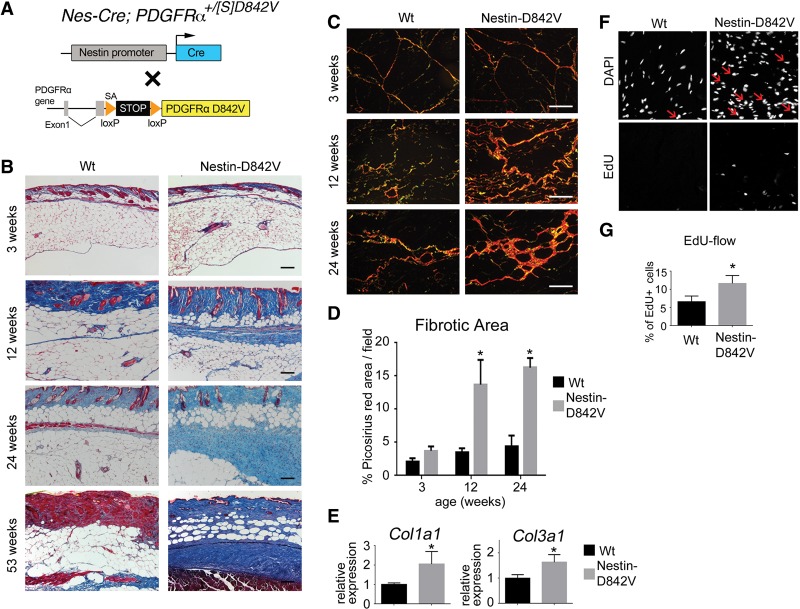
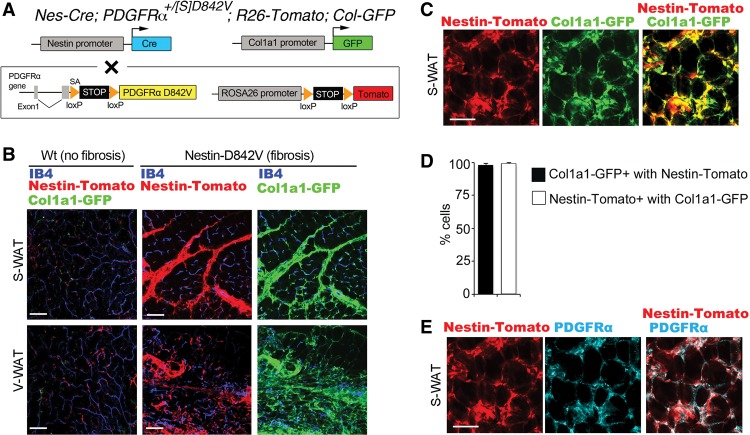
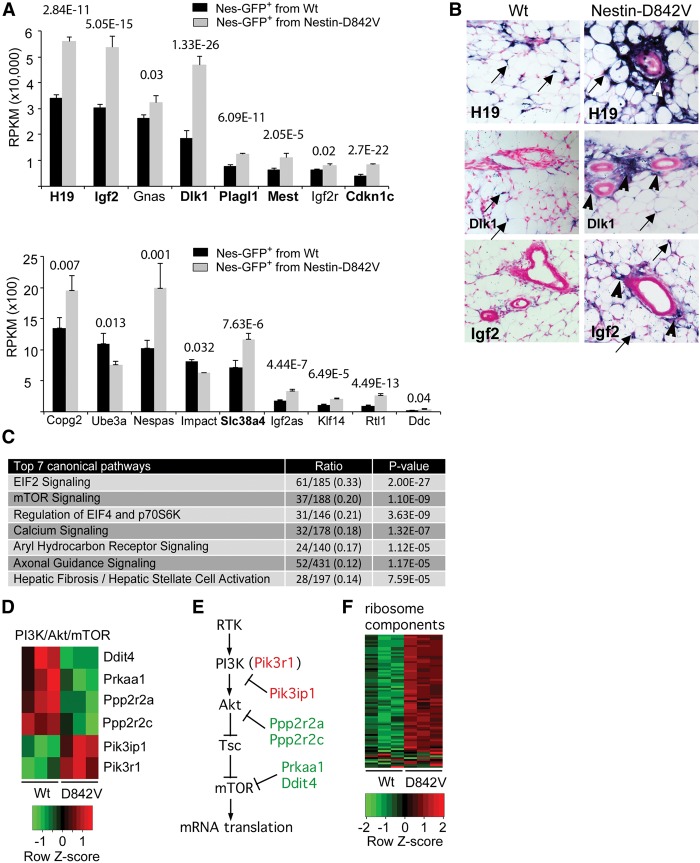
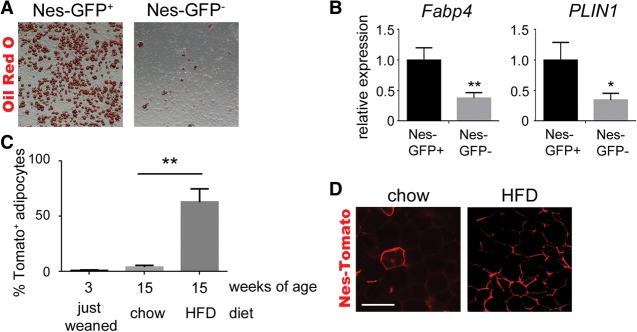
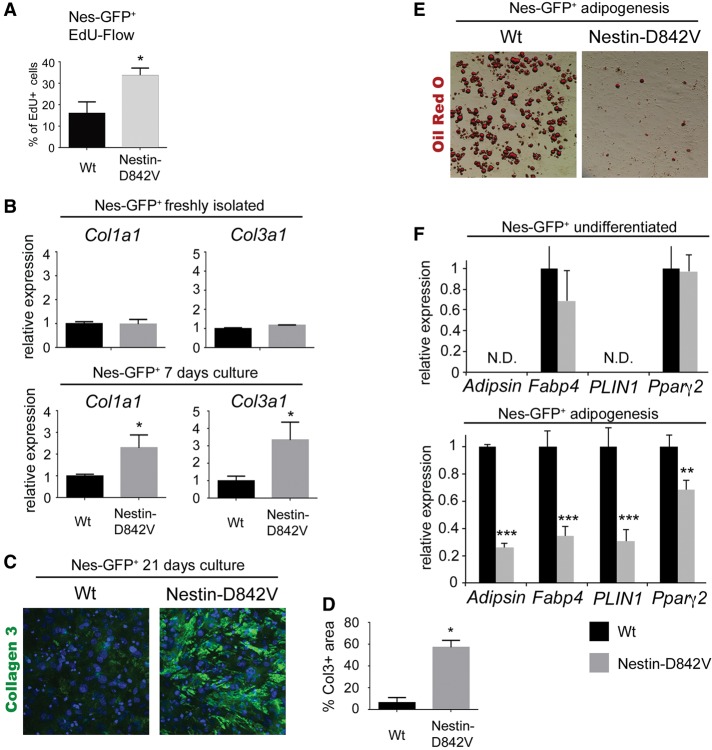
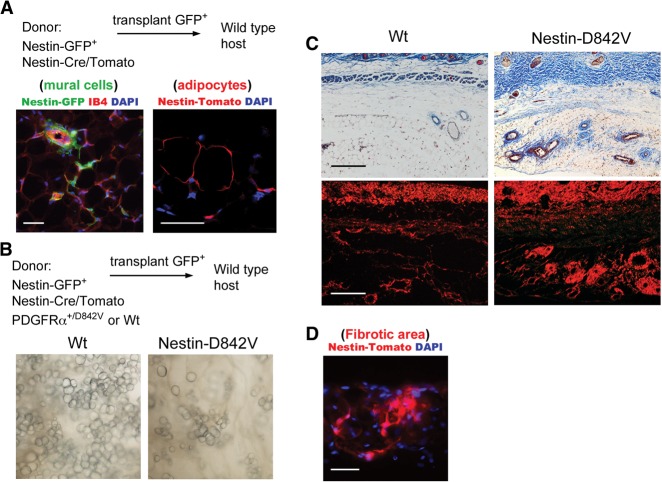
Fibrosis is a common disease process in which profibrotic cells disturb organ function by secreting disorganized extracellular matrix (ECM). Adipose tissue fibrosis occurs during obesity and is associated with metabolic dysfunction, but how profibrotic cells originate is still being elucidated. Here, we use a developmental model to investigate perivascular cells in white adipose tissue (WAT) and their potential to cause organ fibrosis. We show that a Nestin-Cre transgene targets perivascular cells (adventitial cells and pericyte-like cells) in WAT, and Nestin-GFP specifically labels pericyte-like cells. Activation of PDGFRα signaling in perivascular cells causes them to transition into ECM-synthesizing profibrotic cells. Before this transition occurs, PDGFRα signaling up-regulates mTOR signaling and ribosome biogenesis pathways and perturbs the expression of a network of epigenetically imprinted genes that have been implicated in cell growth and tissue homeostasis. Isolated Nestin-GFP(+) cells differentiate into adipocytes ex vivo and form WAT when transplanted into recipient mice. However, PDGFRα signaling opposes adipogenesis and generates profibrotic cells instead, which leads to fibrotic WAT in transplant experiments. These results identify perivascular cells as fibro/adipogenic progenitors in WAT and show that PDGFRα targets progenitor cell plasticity as a profibrotic mechanism.

Keywords: Nestin; adipogenesis; fibrosis; imprinting; pericyte; platelet-derived growth factor.


Figures

Figure 1.
Figure 1.
Nestin-Cre and Nestin-GFP identify perivascular cells in WAT. (A) Schematic of the genetic tools in Nes-GFP; Nes-Cre; R26-Tomato dual-reporter mice used in this figure. GFP and Cre are expressed from distinct nestin-driven transgenes. Cre acts on a Cre/lox-dependent R26 knock-in fluorescent Tomato reporter, which serves as a lineage trace. (B) Epifluorescence of Nes-Cre/Tomato lineage tracing in visceral WAT, imaged by whole-mount with isolectin-IB4 staining for capillary endothelial cells. (C) Measurement of the distance between DAPI+ nuclei of individual Nes-GFP+ cells (n = 167) and the nearest IB4+ capillary membrane, as shown in the example at the right. A distance <10 µm means the cell is on the abluminal surface of the capillary. (D) Epifluorescence of Nes-GFP and Nes-Cre/Tomato plus immunofluorescence staining of Myh11 in vascular smooth muscle cells. The GFP/Tomato reporters are coexpressed in pericyte-like cells (arrowhead). Tomato also identifies adventitial cells in which Nes-GFP is not expressed (arrow). (EI) Epifluorescence of Nes-GFP and Nes-Cre/Tomato plus IB4 labeling for endothelial cells (E), immunofluorescence staining of Cspg4 or PDGFRβ for pericytes (F,G), immunofluorescence staining of collagen IV for basement membrane (H), and immunofluorescence staining of PDGFRα (I). (J) Epifluorescence of Nes-GFP and Nes-Cre/Tomato plus immunofluorescence staining of Perilipin (PLIN1) for adipocytes. Tomato identifies rare adipocytes (arrow) that do not express Nes-GFP. A Tomato+GFP+ pericyte-like cell is also shown (arrowhead). Bars: B, 100 µm; D, 30 µm; E–I, 20 µm; J, 30 µm.
Figure 2.
Figure 2.
PDGFRα activation in perivascular cells is sufficient for fibrosis. (A) Schematic of the genetic tools in Nes-Cre; PDGFRα+/[S]D842V mutant mice used in this figure. Cre acts on the PDGFRαD842V knock-in allele to induce expression of an activated mutant PDGFRα. (B) Masson's trichrome staining for collagen (blue) in dermal and subcutaneous WAT. (C) Picosirius red staining for collagen (orange) in subcutaneous WAT. (D) Quantification of a picosirius red-stained area as a measure of fibrosis. n = 3–6 mice per data point; (*) P < 0.01. (E) Quantitative PCR (qPCR) analysis of collagen transcripts in subcutaneous WAT at 24 wk of age. n = 3; mean ± SEM; (*) P < 0.05. (F) DAPI staining of cell nuclei and EdU labeling for proliferating cells in WAT at 12-wk of age. Arrows indicate EdU/DAPI double-positive nuclei. (G) Flow cytometric quantification of EdU+ cells as a percentage of total cells sorted from subcutaneous WAT at 12 wk of age. n = 6; mean ± SEM; (*) P < 0.05. Bars: B, 120 µm; C, 120 µm.
Figure 3.
Figure 3.
Profibrotic cells originate from perivascular cells. (A) Schematic of the genetic tools in Nes-Cre; PDGFRα+/[S]D842V; R26-Tomato; Col-GFP mutant double-reporter mice used in this figure. Cre acts on the PDGFRαD842V knock-in allele and an R26-Tomato reporter to induce expression of an activated mutant PDGFRα and lineage trace perivascular cells. GFP is expressed from a distinct Col1a1-driven transgene. (B, left panels) Epifluorescence of Nes-Cre/Tomato and Col-GFP plus isolectin-IB4 staining of endothelial cells in nonfibrotic subcutaneous or visceral WAT. (Middle panels) Epifluorescence of Nes-Cre/Tomato plus isolectin-IB4 in fibrotic WAT. (Right panels) Epifluorescence of Col-GFP for identification of ECM-producing cells in the same tissue. The large increase in Tomato+ area in Nestin-D842V samples is mirrored by Col-GFP area. (C) Epifluorescence of Nestin-Cre/Tomato colocalized with Col-GFP in a fibrotic lesion of subcutaneous WAT. (D) Quantification of the proportion of Col-GFP-labeled cells coexpressing Nestin-Cre/Tomato and the proportion of Nestin-Cre/Tomato-labeled cells coexpressing Col-GFP. n = 3; mean ± SEM. (E) Immunofluorescence staining of PDGFRα colocalized with epifluorescence of Nes-Cre/Tomato. Bars: B, 100 µm; C,E, 50 µm.
Figure 4.
Figure 4.
PDGFRα signaling perturbs imprinted gene expression and mTOR/mRNA translation pathways. (A) RNA-seq analysis of differentially expressed imprinted genes. P-values are indicated. Bold genes are part of the IGN. (B) ISH for H19, Dlk1, and Igf2 mRNA in subcutaneous WAT of 4-d-old mice. The blue stain identifies intense gene expression in adventitial cells (arrowheads) in PDGFRαD842V tissue. Scattered pericyte-like cells also show expression in both samples (arrows). (C) Differentially expressed pathways in Nes-GFP+ cells of wild-type or PDGFRαD842V mice, identified by Ingenuity Pathway Analysis of the RNA-seq data. “Canonical pathways” are defined by a cluster of related signature genes, which constitutes the ratio's denominator. The numerator is the number of signature genes that were changed with P < 0.01 in the RNA-seq data set. P-value is the probability that the ratio occurred by chance. (D,E) Heat map of six mTOR pathway signature genes that were differentially expressed and a model representing the PI3K/Akt/mTOR pathway with functional association of the six DEGs. (F) Heat map of 61 genes encoding ribosomal proteins that were differentially expressed and represented as signature genes in the EIF2, mTOR, and EIF4/p70S6K canonical pathways.
Figure 5.
Figure 5.
Nes-GFP+ cells are adipocyte precursors. (A) Representative images of Oil Red O-stained adipocytes differentiated from Nes-GFP or Nes-GFP+ cells. (B) qPCR analysis of mature adipocyte markers after differentiation. Expression in the noninduced group was normalized to 1. n = 3; mean ± SEM; (*) P < 0.05; (**) P < 0.01. (C) Quantification of the percentage of adipocytes in visceral WAT expressing the Nes-Cre/R26-Tomato lineage reporter after 12 wk of chow diet or HFD. n = 3; mean ± SEM; (**) P < 0.0001. (D) Epifluorescence of Nes-Cre/R26-Tomato lineage reporter in visceral WAT after 12 wk of chow diet or HFD. Bar, 100 µm.
Figure 6.
Figure 6.
PDGFRα signaling increases proliferation and ECM production while inhibiting adipogenesis. (A) FACS analysis of cultured Nes-GFP+ cells from control or mutant (Nes-GFP; Nes-Cre; PDGFRα+/[S]D842V) mice after 20 min of incubation with EdU. n = 3; mean ± SD; (*) P < 0.05. (B) qPCR analysis of collagen expression in control or mutant Nes-GFP+ cells freshly isolated or after 1 wk of culture with stabilized ascorbic acid. n = 3; mean ± SEM; (*) P < 0.05. (C) Whole-mount immunofluorescence staining of collagen III protein in fibrotic complexes generated by Nes-GFP+ cells after 3 wk of culture. (D) Quantification of the collagen III-stained area. n = 3; mean ± SD; (*) P < 0.05. (E) Oil Red O-stained adipocytes differentiated from control or mutant Nes-GFP+ cells. (F) qPCR analysis of mature adipocyte markers before and after differentiation. (N.D.) Not detectable. Expression in the wild-type group was normalized to 1. n = 3; mean ± SD; (**) P < 0.01; (***) P < 0.001.
Figure 7.
Figure 7.
Transplanted Nes-GFP+ cells generate adipocytes and profibrotic cells. (A) Experimental scheme to transplant Nes-GFP+ cells with Nes-Cre/Tomato lineage tracing in Matrigel plugs into wild-type mice, with analysis at 3 wk after transplantation. (Mural cells) Epifluorescence of Nes-GFP with IB4 staining of endothelial cells identified persistence of GFP+ cells. (Adipocytes) Epifluorescence of Nes-Cre/Tomato identified donor-derived adipocytes. (B) Experimental scheme to transplant Nes-GFP+ cells with Nes-Cre/Tomato and either PDGFRαD842V or wild-type PDGFRα. Analysis at 12 wk after transplantation: phase contrast image of newly generated WAT, with abundant adipocytes in the control but sparse adipocytes in the mutant. (C) Trichrome staining (top) or picosirius red stain (bottom) of newly generated WAT 12 wk after transplantation, with perivascular fibrosis in the mutant. (D) Epifluorescence of Nes-Cre/Tomato in perivascular fibrotic areas demonstrating profibrotic cells of donor origin. Bars: A, 50 µm; C, 100 µm; D, 50 µm.

References

    1. Abdollahi A, Li M, Ping G, Plathow C, Domhan S, Kiessling F, Lee LB, McMahon G, Grone HJ, Lipson KE, et al. 2005. Inhibition of platelet-derived growth factor signaling attenuates pulmonary fibrosis. J Exp Med 201: 925–935. - PMC - PubMed
    1. Adalsteinsson BT, Ferguson-Smith AC. 2014. Epigenetic control of the genome-lessons from genomic imprinting. Genes 5: 635–655. - PMC - PubMed
    1. Akhmetshina A, Venalis P, Dees C, Busch N, Zwerina J, Schett G, Distler O, Distler JH. 2009. Treatment with imatinib prevents fibrosis in different preclinical models of systemic sclerosis and induces regression of established fibrosis. Arthritis Rheum 60: 219–224. - PubMed
    1. Andrae J, Gallini R, Betsholtz C. 2008. Role of platelet-derived growth factors in physiology and medicine. Genes Dev 22: 1276–1312. - PMC - PubMed
    1. Armulik A, Genove G, Betsholtz C. 2011. Pericytes: developmental, physiological, and pathological perspectives, problems, and promises. Dev Cell 21: 193–215. - PubMed

Publication types

MeSH terms

Substances

Associated data